Why Sterlite Technologies Limited’s (NSE:STRTECH) High P/E Ratio Isn’t Necessarily A Bad Thing

The goal of this article is to teach you how to use price to earnings ratios (P/E ratios). To keep it practical, we’ll show how Sterlite Technologies Limited’s (NSE:STRTECH) P/E ratio could help you assess the value on offer. Sterlite Technologies has a P/E ratio of 17.1, based on the last twelve months. In other words, at today’s prices, investors are paying ₹17.1 for every ₹1 in prior year profit.
View our latest analysis for Sterlite Technologies
Want to participate in a research study? Help shape the future of investing tools and earn a $60 gift card!
How Do I Calculate Sterlite Technologies’s Price To Earnings Ratio?
The formula for P/E is:
Price to Earnings Ratio = Share Price ÷ Earnings per Share (EPS)
Or for Sterlite Technologies:
P/E of 17.1 = ₹222 ÷ ₹12.98 (Based on the trailing twelve months to December 2018.)
Is A High Price-to-Earnings Ratio Good?
A higher P/E ratio means that investors are paying a higher price for each ₹1 of company earnings. That isn’t necessarily good or bad, but a high P/E implies relatively high expectations of what a company can achieve in the future.
How Growth Rates Impact P/E Ratios
Earnings growth rates have a big influence on P/E ratios. When earnings grow, the ‘E’ increases, over time. That means unless the share price increases, the P/E will reduce in a few years. Then, a lower P/E should attract more buyers, pushing the share price up.
Notably, Sterlite Technologies grew EPS by a whopping 81% in the last year. And its annual EPS growth rate over 5 years is 45%. With that performance, I would expect it to have an above average P/E ratio.
How Does Sterlite Technologies’s P/E Ratio Compare To Its Peers?
The P/E ratio essentially measures market expectations of a company. You can see in the image below that the average P/E (15.1) for companies in the communications industry is lower than Sterlite Technologies’s P/E.
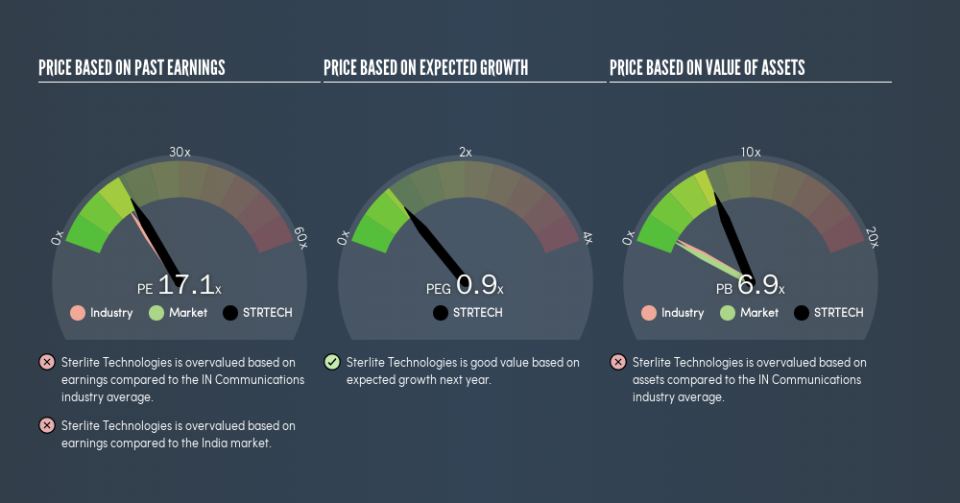
That means that the market expects Sterlite Technologies will outperform other companies in its industry. Shareholders are clearly optimistic, but the future is always uncertain. So further research is always essential. I often monitor director buying and selling.
A Limitation: P/E Ratios Ignore Debt and Cash In The Bank
The ‘Price’ in P/E reflects the market capitalization of the company. In other words, it does not consider any debt or cash that the company may have on the balance sheet. Theoretically, a business can improve its earnings (and produce a lower P/E in the future), by taking on debt (or spending its remaining cash).
Such spending might be good or bad, overall, but the key point here is that you need to look at debt to understand the P/E ratio in context.
How Does Sterlite Technologies’s Debt Impact Its P/E Ratio?
Sterlite Technologies has net debt worth 18% of its market capitalization. This could bring some additional risk, and reduce the number of investment options for management; worth remembering if you compare its P/E to businesses without debt.
The Verdict On Sterlite Technologies’s P/E Ratio
Sterlite Technologies has a P/E of 17.1. That’s around the same as the average in the IN market, which is 16.3. When you consider the impressive EPS growth last year (along with some debt), it seems the market has questions about whether rapid EPS growth will be sustained. Since analysts are predicting growth will continue, one might expect to see a higher P/E so it may be worth looking closer.
Investors have an opportunity when market expectations about a stock are wrong. As value investor Benjamin Graham famously said, ‘In the short run, the market is a voting machine but in the long run, it is a weighing machine.’ So this free visualization of the analyst consensus on future earnings could help you make the right decision about whether to buy, sell, or hold.
You might be able to find a better buy than Sterlite Technologies. If you want a selection of possible winners, check out this free list of interesting companies that trade on a P/E below 20 (but have proven they can grow earnings).
We aim to bring you long-term focused research analysis driven by fundamental data. Note that our analysis may not factor in the latest price-sensitive company announcements or qualitative material.
If you spot an error that warrants correction, please contact the editor at editorial-team@simplywallst.com. This article by Simply Wall St is general in nature. It does not constitute a recommendation to buy or sell any stock, and does not take account of your objectives, or your financial situation. Simply Wall St has no position in the stocks mentioned. Thank you for reading.
