Why Sword Group S.E.’s (EPA:SWP) Use Of Investor Capital Doesn’t Look Great

Today we'll evaluate Sword Group S.E. (EPA:SWP) to determine whether it could have potential as an investment idea. Specifically, we'll consider its Return On Capital Employed (ROCE), since that will give us an insight into how efficiently the business can generate profits from the capital it requires.
Firstly, we'll go over how we calculate ROCE. Next, we'll compare it to others in its industry. And finally, we'll look at how its current liabilities are impacting its ROCE.
Understanding Return On Capital Employed (ROCE)
ROCE is a measure of a company's yearly pre-tax profit (its return), relative to the capital employed in the business. Generally speaking a higher ROCE is better. Overall, it is a valuable metric that has its flaws. Renowned investment researcher Michael Mauboussin has suggested that a high ROCE can indicate that 'one dollar invested in the company generates value of more than one dollar'.
How Do You Calculate Return On Capital Employed?
The formula for calculating the return on capital employed is:
Return on Capital Employed = Earnings Before Interest and Tax (EBIT) ÷ (Total Assets - Current Liabilities)
Or for Sword Group:
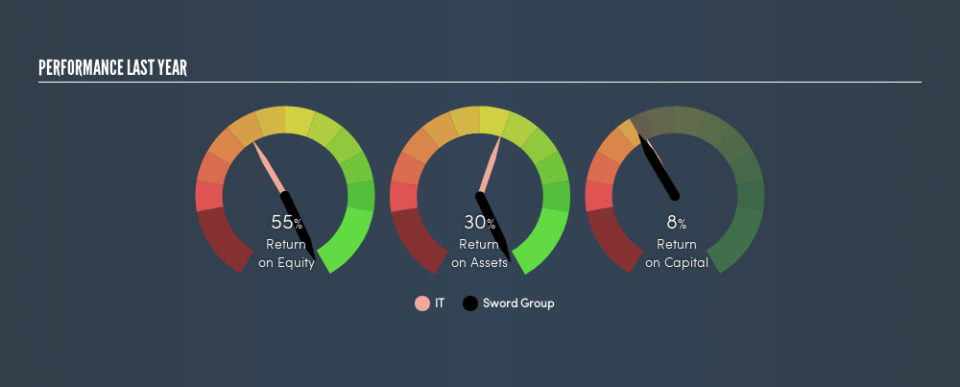
0.083 = €16m ÷ (€268m - €82m) (Based on the trailing twelve months to December 2018.)
So, Sword Group has an ROCE of 8.3%.
Want to participate in a short research study? Help shape the future of investing tools and you could win a $250 gift card!
See our latest analysis for Sword Group
Does Sword Group Have A Good ROCE?
ROCE can be useful when making comparisons, such as between similar companies. We can see Sword Group's ROCE is meaningfully below the IT industry average of 11%. This performance could be negative if sustained, as it suggests the business may underperform its industry. Separate from how Sword Group stacks up against its industry, its ROCE in absolute terms is mediocre; relative to the returns on government bonds. Investors may wish to consider higher-performing investments.
When considering ROCE, bear in mind that it reflects the past and does not necessarily predict the future. ROCE can be misleading for companies in cyclical industries, with returns looking impressive during the boom times, but very weak during the busts. ROCE is, after all, simply a snap shot of a single year. Since the future is so important for investors, you should check out our free report on analyst forecasts for Sword Group.
What Are Current Liabilities, And How Do They Affect Sword Group's ROCE?
Current liabilities are short term bills and invoices that need to be paid in 12 months or less. The ROCE equation subtracts current liabilities from capital employed, so a company with a lot of current liabilities appears to have less capital employed, and a higher ROCE than otherwise. To check the impact of this, we calculate if a company has high current liabilities relative to its total assets.
Sword Group has total assets of €268m and current liabilities of €82m. As a result, its current liabilities are equal to approximately 31% of its total assets. Sword Group's ROCE is improved somewhat by its moderate amount of current liabilities.
What We Can Learn From Sword Group's ROCE
Unfortunately, its ROCE is still uninspiring, and there are potentially more attractive prospects out there. You might be able to find a better investment than Sword Group. If you want a selection of possible winners, check out this free list of interesting companies that trade on a P/E below 20 (but have proven they can grow earnings).
I will like Sword Group better if I see some big insider buys. While we wait, check out this free list of growing companies with considerable, recent, insider buying.
We aim to bring you long-term focused research analysis driven by fundamental data. Note that our analysis may not factor in the latest price-sensitive company announcements or qualitative material.
If you spot an error that warrants correction, please contact the editor at editorial-team@simplywallst.com. This article by Simply Wall St is general in nature. It does not constitute a recommendation to buy or sell any stock, and does not take account of your objectives, or your financial situation. Simply Wall St has no position in the stocks mentioned. Thank you for reading.
