Why Thomson Medical Group Limited’s (SGX:A50) Use Of Investor Capital Doesn’t Look Great

Today we are going to look at Thomson Medical Group Limited (SGX:A50) to see whether it might be an attractive investment prospect. In particular, we'll consider its Return On Capital Employed (ROCE), as that can give us insight into how profitably the company is able to employ capital in its business.
First, we'll go over how we calculate ROCE. Then we'll compare its ROCE to similar companies. Then we'll determine how its current liabilities are affecting its ROCE.
Return On Capital Employed (ROCE): What is it?
ROCE measures the 'return' (pre-tax profit) a company generates from capital employed in its business. Generally speaking a higher ROCE is better. In brief, it is a useful tool, but it is not without drawbacks. Renowned investment researcher Michael Mauboussin has suggested that a high ROCE can indicate that 'one dollar invested in the company generates value of more than one dollar'.
So, How Do We Calculate ROCE?
Analysts use this formula to calculate return on capital employed:
Return on Capital Employed = Earnings Before Interest and Tax (EBIT) ÷ (Total Assets - Current Liabilities)
Or for Thomson Medical Group:
0.039 = S$39m ÷ (S$1.3b - S$298m) (Based on the trailing twelve months to June 2019.)
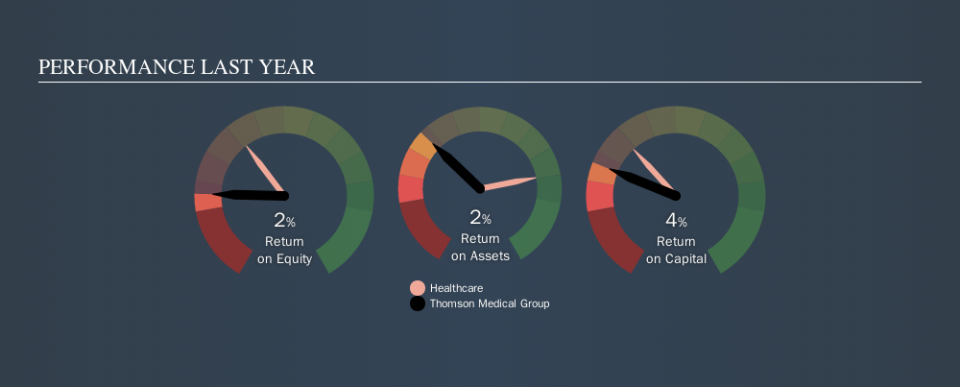
Therefore, Thomson Medical Group has an ROCE of 3.9%.
View our latest analysis for Thomson Medical Group
Does Thomson Medical Group Have A Good ROCE?
One way to assess ROCE is to compare similar companies. In this analysis, Thomson Medical Group's ROCE appears meaningfully below the 13% average reported by the Healthcare industry. This performance is not ideal, as it suggests the company may not be deploying its capital as effectively as some competitors. Putting aside Thomson Medical Group's performance relative to its industry, its ROCE in absolute terms is poor - considering the risk of owning stocks compared to government bonds. There are potentially more appealing investments elsewhere.
Thomson Medical Group's current ROCE of 3.9% is lower than its ROCE in the past, which was 6.9%, 3 years ago. This makes us wonder if the business is facing new challenges. You can click on the image below to see (in greater detail) how Thomson Medical Group's past growth compares to other companies.
When considering this metric, keep in mind that it is backwards looking, and not necessarily predictive. ROCE can be misleading for companies in cyclical industries, with returns looking impressive during the boom times, but very weak during the busts. This is because ROCE only looks at one year, instead of considering returns across a whole cycle. If Thomson Medical Group is cyclical, it could make sense to check out this free graph of past earnings, revenue and cash flow.
Thomson Medical Group's Current Liabilities And Their Impact On Its ROCE
Liabilities, such as supplier bills and bank overdrafts, are referred to as current liabilities if they need to be paid within 12 months. The ROCE equation subtracts current liabilities from capital employed, so a company with a lot of current liabilities appears to have less capital employed, and a higher ROCE than otherwise. To counter this, investors can check if a company has high current liabilities relative to total assets.
Thomson Medical Group has total assets of S$1.3b and current liabilities of S$298m. Therefore its current liabilities are equivalent to approximately 23% of its total assets. This is a modest level of current liabilities, which will have a limited impact on the ROCE.
Our Take On Thomson Medical Group's ROCE
That's not a bad thing, however Thomson Medical Group has a weak ROCE and may not be an attractive investment. But note: make sure you look for a great company, not just the first idea you come across. So take a peek at this free list of interesting companies with strong recent earnings growth (and a P/E ratio below 20).
If you like to buy stocks alongside management, then you might just love this free list of companies. (Hint: insiders have been buying them).
We aim to bring you long-term focused research analysis driven by fundamental data. Note that our analysis may not factor in the latest price-sensitive company announcements or qualitative material.
If you spot an error that warrants correction, please contact the editor at editorial-team@simplywallst.com. This article by Simply Wall St is general in nature. It does not constitute a recommendation to buy or sell any stock, and does not take account of your objectives, or your financial situation. Simply Wall St has no position in the stocks mentioned. Thank you for reading.

