Why Uniphos Enterprises Limited’s (NSE:UNIPHOS) Return On Capital Employed Might Be A Concern

Today we'll look at Uniphos Enterprises Limited (NSE:UNIPHOS) and reflect on its potential as an investment. Specifically, we're going to calculate its Return On Capital Employed (ROCE), in the hopes of getting some insight into the business.
Firstly, we'll go over how we calculate ROCE. Second, we'll look at its ROCE compared to similar companies. Then we'll determine how its current liabilities are affecting its ROCE.
What is Return On Capital Employed (ROCE)?
ROCE measures the 'return' (pre-tax profit) a company generates from capital employed in its business. In general, businesses with a higher ROCE are usually better quality. In brief, it is a useful tool, but it is not without drawbacks. Renowned investment researcher Michael Mauboussin has suggested that a high ROCE can indicate that 'one dollar invested in the company generates value of more than one dollar'.
So, How Do We Calculate ROCE?
The formula for calculating the return on capital employed is:
Return on Capital Employed = Earnings Before Interest and Tax (EBIT) ÷ (Total Assets - Current Liabilities)
Or for Uniphos Enterprises:
0.0078 = ₹212m ÷ (₹27b - ₹1.8m) (Based on the trailing twelve months to March 2019.)
So, Uniphos Enterprises has an ROCE of 0.8%.
Want to participate in a short research study? Help shape the future of investing tools and you could win a $250 gift card!
Check out our latest analysis for Uniphos Enterprises
Does Uniphos Enterprises Have A Good ROCE?
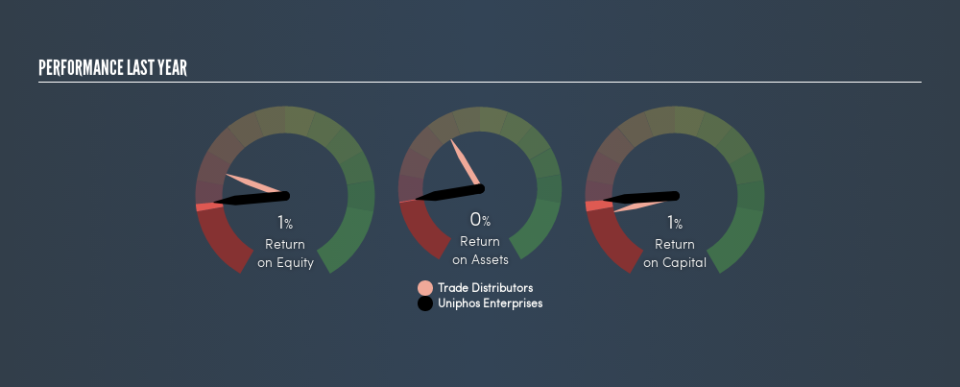
ROCE can be useful when making comparisons, such as between similar companies. We can see Uniphos Enterprises's ROCE is meaningfully below the Trade Distributors industry average of 5.8%. This could be seen as a negative, as it suggests some competitors may be employing their capital more efficiently. Regardless of how Uniphos Enterprises stacks up against its industry, its ROCE in absolute terms is quite low (especially compared to a bank account). Readers may wish to look for more rewarding investments.
Uniphos Enterprises has an ROCE of 0.8%, but it didn't have an ROCE 3 years ago, since it was unprofitable. This makes us wonder if the company is improving.
When considering ROCE, bear in mind that it reflects the past and does not necessarily predict the future. ROCE can be deceptive for cyclical businesses, as returns can look incredible in boom times, and terribly low in downturns. ROCE is, after all, simply a snap shot of a single year. You can check if Uniphos Enterprises has cyclical profits by looking at this free graph of past earnings, revenue and cash flow.
Uniphos Enterprises's Current Liabilities And Their Impact On Its ROCE
Current liabilities include invoices, such as supplier payments, short-term debt, or a tax bill, that need to be paid within 12 months. Due to the way the ROCE equation works, having large bills due in the near term can make it look as though a company has less capital employed, and thus a higher ROCE than usual. To counteract this, we check if a company has high current liabilities, relative to its total assets.
Uniphos Enterprises has total liabilities of ₹1.8m and total assets of ₹27b. Therefore its current liabilities are equivalent to approximately 0.007% of its total assets. With barely any current liabilities, there is minimal impact on Uniphos Enterprises's admittedly low ROCE.
What We Can Learn From Uniphos Enterprises's ROCE
Still, investors could probably find more attractive prospects with better performance out there. But note: make sure you look for a great company, not just the first idea you come across. So take a peek at this free list of interesting companies with strong recent earnings growth (and a P/E ratio below 20).
I will like Uniphos Enterprises better if I see some big insider buys. While we wait, check out this free list of growing companies with considerable, recent, insider buying.
We aim to bring you long-term focused research analysis driven by fundamental data. Note that our analysis may not factor in the latest price-sensitive company announcements or qualitative material.
If you spot an error that warrants correction, please contact the editor at editorial-team@simplywallst.com. This article by Simply Wall St is general in nature. It does not constitute a recommendation to buy or sell any stock, and does not take account of your objectives, or your financial situation. Simply Wall St has no position in the stocks mentioned. Thank you for reading.

