Why We Like Verallia Deutschland AG’s (FRA:OLG) 28% Return On Capital Employed

Today we are going to look at Verallia Deutschland AG (FRA:OLG) to see whether it might be an attractive investment prospect. Specifically, we'll consider its Return On Capital Employed (ROCE), since that will give us an insight into how efficiently the business can generate profits from the capital it requires.
Firstly, we'll go over how we calculate ROCE. Next, we'll compare it to others in its industry. And finally, we'll look at how its current liabilities are impacting its ROCE.
Understanding Return On Capital Employed (ROCE)
ROCE measures the amount of pre-tax profits a company can generate from the capital employed in its business. Generally speaking a higher ROCE is better. Ultimately, it is a useful but imperfect metric. Renowned investment researcher Michael Mauboussin has suggested that a high ROCE can indicate that 'one dollar invested in the company generates value of more than one dollar'.
How Do You Calculate Return On Capital Employed?
Analysts use this formula to calculate return on capital employed:
Return on Capital Employed = Earnings Before Interest and Tax (EBIT) ÷ (Total Assets - Current Liabilities)
Or for Verallia Deutschland:
0.28 = €78m ÷ (€464m - €189m) (Based on the trailing twelve months to December 2019.)
Therefore, Verallia Deutschland has an ROCE of 28%.
View our latest analysis for Verallia Deutschland
Does Verallia Deutschland Have A Good ROCE?
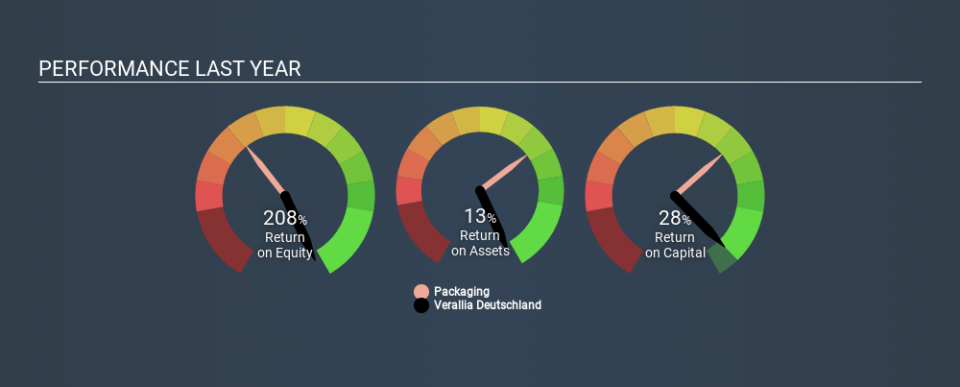
When making comparisons between similar businesses, investors may find ROCE useful. In our analysis, Verallia Deutschland's ROCE is meaningfully higher than the 11% average in the Packaging industry. We consider this a positive sign, because it suggests it uses capital more efficiently than similar companies. Regardless of the industry comparison, in absolute terms, Verallia Deutschland's ROCE currently appears to be excellent.
We can see that, Verallia Deutschland currently has an ROCE of 28% compared to its ROCE 3 years ago, which was 18%. This makes us think about whether the company has been reinvesting shrewdly. The image below shows how Verallia Deutschland's ROCE compares to its industry, and you can click it to see more detail on its past growth.
Remember that this metric is backwards looking - it shows what has happened in the past, and does not accurately predict the future. ROCE can be misleading for companies in cyclical industries, with returns looking impressive during the boom times, but very weak during the busts. ROCE is only a point-in-time measure. How cyclical is Verallia Deutschland? You can see for yourself by looking at this free graph of past earnings, revenue and cash flow.
How Verallia Deutschland's Current Liabilities Impact Its ROCE
Current liabilities are short term bills and invoices that need to be paid in 12 months or less. Due to the way ROCE is calculated, a high level of current liabilities makes a company look as though it has less capital employed, and thus can (sometimes unfairly) boost the ROCE. To counteract this, we check if a company has high current liabilities, relative to its total assets.
Verallia Deutschland has current liabilities of €189m and total assets of €464m. Therefore its current liabilities are equivalent to approximately 41% of its total assets. A medium level of current liabilities boosts Verallia Deutschland's ROCE somewhat.
The Bottom Line On Verallia Deutschland's ROCE
Still, it has a high ROCE, and may be an interesting prospect for further research. Verallia Deutschland shapes up well under this analysis, but it is far from the only business delivering excellent numbers . You might also want to check this free collection of companies delivering excellent earnings growth.
If you like to buy stocks alongside management, then you might just love this free list of companies. (Hint: insiders have been buying them).
If you spot an error that warrants correction, please contact the editor at editorial-team@simplywallst.com. This article by Simply Wall St is general in nature. It does not constitute a recommendation to buy or sell any stock, and does not take account of your objectives, or your financial situation. Simply Wall St has no position in the stocks mentioned.
We aim to bring you long-term focused research analysis driven by fundamental data. Note that our analysis may not factor in the latest price-sensitive company announcements or qualitative material. Thank you for reading.

