Why Vision International Holdings Limited (HKG:8107) Looks Like A Quality Company

Want to participate in a research study? Help shape the future of investing tools and earn a $60 gift card!
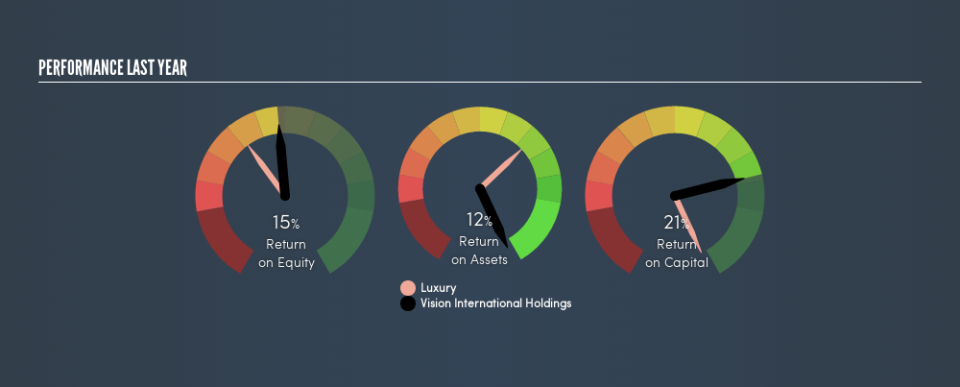
Many investors are still learning about the various metrics that can be useful when analysing a stock. This article is for those who would like to learn about Return On Equity (ROE). By way of learning-by-doing, we'll look at ROE to gain a better understanding of Vision International Holdings Limited (HKG:8107).
Vision International Holdings has a ROE of 15%, based on the last twelve months. That means that for every HK$1 worth of shareholders' equity, it generated HK$0.15 in profit.
View our latest analysis for Vision International Holdings
How Do I Calculate ROE?
The formula for return on equity is:
Return on Equity = Net Profit ÷ Shareholders' Equity
Or for Vision International Holdings:
15% = HK$13m ÷ HK$82m (Based on the trailing twelve months to December 2018.)
Most readers would understand what net profit is, but it’s worth explaining the concept of shareholders’ equity. It is all the money paid into the company from shareholders, plus any earnings retained. Shareholders' equity can be calculated by subtracting the total liabilities of the company from the total assets of the company.
What Does ROE Signify?
ROE measures a company's profitability against the profit it retains, and any outside investments. The 'return' is the profit over the last twelve months. A higher profit will lead to a higher ROE. So, as a general rule, a high ROE is a good thing. Clearly, then, one can use ROE to compare different companies.
Does Vision International Holdings Have A Good ROE?
One simple way to determine if a company has a good return on equity is to compare it to the average for its industry. Importantly, this is far from a perfect measure, because companies differ significantly within the same industry classification. Pleasingly, Vision International Holdings has a superior ROE than the average (10%) company in the Luxury industry.
That's what I like to see. I usually take a closer look when a company has a better ROE than industry peers. For example, I often check if insiders have been buying shares .
How Does Debt Impact Return On Equity?
Companies usually need to invest money to grow their profits. The cash for investment can come from prior year profits (retained earnings), issuing new shares, or borrowing. In the first two cases, the ROE will capture this use of capital to grow. In the latter case, the use of debt will improve the returns, but will not change the equity. That will make the ROE look better than if no debt was used.
Combining Vision International Holdings's Debt And Its 15% Return On Equity
Vision International Holdings has a debt to equity ratio of 0.13, which is far from excessive. The combination of modest debt and a very respectable ROE suggests this is a business worth watching. Conservative use of debt to boost returns is usually a good move for shareholders, though it does leave the company more exposed to interest rate rises.
The Key Takeaway
Return on equity is a useful indicator of the ability of a business to generate profits and return them to shareholders. Companies that can achieve high returns on equity without too much debt are generally of good quality. All else being equal, a higher ROE is better.
But ROE is just one piece of a bigger puzzle, since high quality businesses often trade on high multiples of earnings. It is important to consider other factors, such as future profit growth -- and how much investment is required going forward. You can see how the company has grow in the past by looking at this FREE detailed graph of past earnings, revenue and cash flow.
But note: Vision International Holdings may not be the best stock to buy. So take a peek at this free list of interesting companies with high ROE and low debt.
We aim to bring you long-term focused research analysis driven by fundamental data. Note that our analysis may not factor in the latest price-sensitive company announcements or qualitative material.
If you spot an error that warrants correction, please contact the editor at editorial-team@simplywallst.com. This article by Simply Wall St is general in nature. It does not constitute a recommendation to buy or sell any stock, and does not take account of your objectives, or your financial situation. Simply Wall St has no position in the stocks mentioned. Thank you for reading.

