Wilmar International Limited (SGX:F34) Is Yielding 2.7% - But Is It A Buy?

Is Wilmar International Limited (SGX:F34) a good dividend stock? How can we tell? Dividend paying companies with growing earnings can be highly rewarding in the long term. On the other hand, investors have been known to buy a stock because of its yield, and then lose money if the company's dividend doesn't live up to expectations.
While Wilmar International's 2.7% dividend yield is not the highest, we think its lengthy payment history is quite interesting. Before you buy any stock for its dividend however, you should always remember Warren Buffett's two rules: 1) Don't lose money, and 2) Remember rule #1. We'll run through some checks below to help with this.
Explore this interactive chart for our latest analysis on Wilmar International!
Payout ratios
Dividends are usually paid out of company earnings. If a company is paying more than it earns, then the dividend might become unsustainable - hardly an ideal situation. So we need to form a view on if a company's dividend is sustainable, relative to its net profit after tax. Wilmar International paid out 42% of its profit as dividends, over the trailing twelve month period. This is a middling range that strikes a nice balance between paying dividends to shareholders, and retaining enough earnings to invest in future growth. Besides, if reinvestment opportunities dry up, the company has room to increase the dividend.
Another important check we do is to see if the free cash flow generated is sufficient to pay the dividend. Wilmar International paid out a conservative 30% of its free cash flow as dividends last year. It's positive to see that Wilmar International's dividend is covered by both profits and cash flow, since this is generally a sign that the dividend is sustainable, and a lower payout ratio usually suggests a greater margin of safety before the dividend gets cut.
Is Wilmar International's Balance Sheet Risky?
As Wilmar International has a meaningful amount of debt, we need to check its balance sheet to see if the company might have debt risks. A quick check of its financial situation can be done with two ratios: net debt divided by EBITDA (earnings before interest, tax, depreciation and amortisation), and net interest cover. Net debt to EBITDA is a measure of a company's total debt. Net interest cover measures the ability to meet interest payments. Essentially we check that a) the company does not have too much debt, and b) that it can afford to pay the interest. With net debt of 7.65 times its EBITDA, Wilmar International could be described as a highly leveraged company. While some companies can handle this level of leverage, we'd be concerned about the dividend sustainability if there was any risk of an earnings downturn.
We calculated its interest cover by measuring its earnings before interest and tax (EBIT), and dividing this by the company's net interest expense. Interest cover of 3.82 times its interest expense is starting to become a concern for Wilmar International, and be aware that lenders may place additional restrictions on the company as well. Low interest cover and high debt can create problems right when the investor least needs them, and we're reluctant to rely on the dividend of companies with these traits.
We update our data on Wilmar International every 24 hours, so you can always get our latest analysis of its financial health, here.
Dividend Volatility
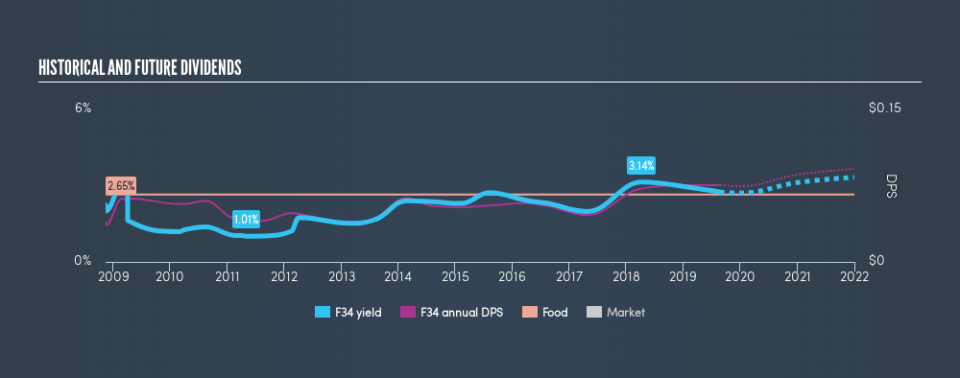
Before buying a stock for its income, we want to see if the dividends have been stable in the past, and if the company has a track record of maintaining its dividend. Wilmar International has been paying dividends for a long time, but for the purpose of this analysis, we only examine the past 10 years of payments. This dividend has been unstable, which we define as having fallen by at least 20% one or more times over this time. During the past ten-year period, the first annual payment was US$0.039 in 2009, compared to US$0.076 last year. Dividends per share have grown at approximately 6.8% per year over this time. The growth in dividends has not been linear, but the CAGR is a decent approximation of the rate of change over this time frame.
A reasonable rate of dividend growth is good to see, but we're wary that the dividend history is not as solid as we'd like, having been cut at least once.
Dividend Growth Potential
Given that the dividend has been cut in the past, we need to check if earnings are growing and if that might lead to stronger dividends in the future. It's not great to see that Wilmar International's have fallen at approximately 3.4% over the past five years. If earnings continue to decline, the dividend may come under pressure. Every investor should make an assessment of whether the company is taking steps to stabilise the situation.
Conclusion
To summarise, shareholders should always check that Wilmar International's dividends are affordable, that its dividend payments are relatively stable, and that it has decent prospects for growing its earnings and dividend. First, we like that the company's dividend payments appear well covered, although the retained capital also needs to be effectively reinvested. Second, earnings per share have been essentially flat, and its history of dividend payments is chequered - having cut its dividend at least once in the past. While we're not hugely bearish on it, overall we think there are potentially better dividend stocks than Wilmar International out there.
Given that earnings are not growing, the dividend does not look nearly so attractive. Businesses can change though, and we think it would make sense to see what analysts are forecasting for the company.
If you are a dividend investor, you might also want to look at our curated list of dividend stocks yielding above 3%.
We aim to bring you long-term focused research analysis driven by fundamental data. Note that our analysis may not factor in the latest price-sensitive company announcements or qualitative material.
If you spot an error that warrants correction, please contact the editor at editorial-team@simplywallst.com. This article by Simply Wall St is general in nature. It does not constitute a recommendation to buy or sell any stock, and does not take account of your objectives, or your financial situation. Simply Wall St has no position in the stocks mentioned. Thank you for reading.
