Can a Win Streak Predict the Market's Next Move?
The S&P 500 Index's (SPX) longest winning streak of the year came to an end yesterday. The benchmark gained 5.7% during the five-day winning streak, and it made me curious as to how the index behaves depending on its streak of wins or losses. Does each day of gains decrease the chance of the next day being positive? Or is it like a coin, which has the same 50/50 chance of heads no matter how many heads have been tossed in a row? The information is interesting and might give us insight into what to expect during these streaks.
S&P 500 Winning & Losing Streaks
Going back to 1950, I summarized the daily returns for the S&P 500 depending on whether it was on a winning streak or losing streak, in addition to the length of the streak.
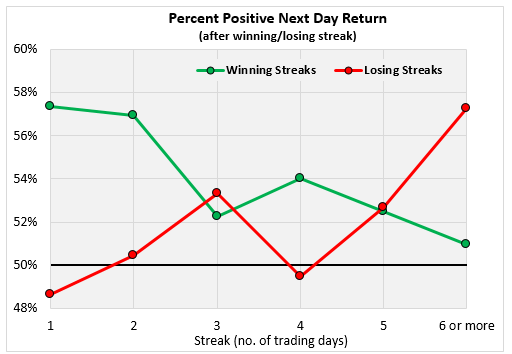
First, I looked at whether a streak of wins or losses influenced whether the next day would be an up day or down day. The chart shows that after one or two up days, the probability of a positive day was around 57%-58%. After a couple days of gains, the chances of a positive day falls to the lower 50s. After one down day, the S&P 500 has been down over 50% of the time. The chances of an up day goes up over 50% after that. Oddly, after exactly four consecutive down days, the odds of an up day falls back below 50% before spiking back up. After a six-day losing streak or more, the odds of an up day is over 57%.
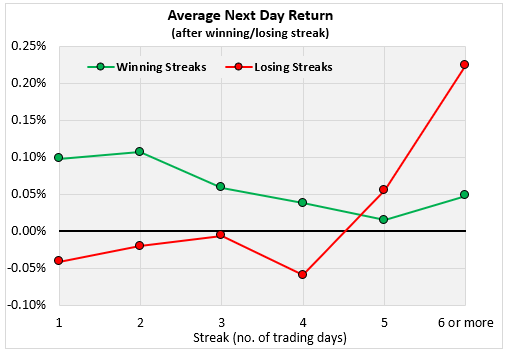
Next, I have a chart of the average SPX returns the day after daily winning or losing streaks. Based only on this, a trader would buy at the close of a positive day and average a gain in their account. The average return, however, declines as the winning streak gets longer. Also, a trader would sell at the close of a down day until the losing streak reached five trading days. The average return has spiked after losing streaks of five days or more.
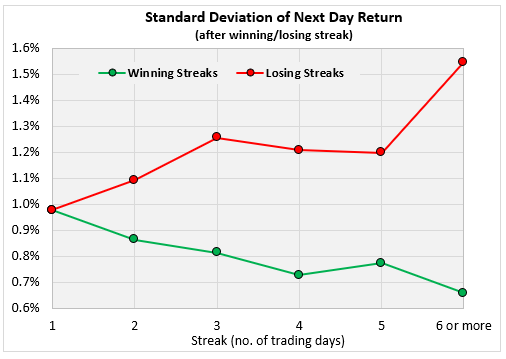
The last stat I looked at is the standard deviation of returns. It correlates well with winning and losing streaks. When the streak is at one day -- whether it’s a winning streak or losing streak -- the standard deviation of the return the next day has been about 0.98. From there, it drifted lower as the winning steak lasted longer, and it moved higher with losing streaks.