Worley Limited (ASX:WOR) Is Up But Financials Look Inconsistent: Which Way Is The Stock Headed?
Worley's (ASX:WOR) stock up by 8.4% over the past three months. However, we decided to study the company's mixed-bag of fundamentals to assess what this could mean for future share prices, as stock prices tend to be aligned with a company's long-term financial performance. Particularly, we will be paying attention to Worley's ROE today.
ROE or return on equity is a useful tool to assess how effectively a company can generate returns on the investment it received from its shareholders. Simply put, it is used to assess the profitability of a company in relation to its equity capital.
View our latest analysis for Worley
How To Calculate Return On Equity?
Return on equity can be calculated by using the formula:
Return on Equity = Net Profit (from continuing operations) ÷ Shareholders' Equity
So, based on the above formula, the ROE for Worley is:
1.5% = AU$84m ÷ AU$5.5b (Based on the trailing twelve months to December 2020).
The 'return' refers to a company's earnings over the last year. One way to conceptualize this is that for each A$1 of shareholders' capital it has, the company made A$0.02 in profit.
Why Is ROE Important For Earnings Growth?
Thus far, we have learned that ROE measures how efficiently a company is generating its profits. Based on how much of its profits the company chooses to reinvest or "retain", we are then able to evaluate a company's future ability to generate profits. Assuming all else is equal, companies that have both a higher return on equity and higher profit retention are usually the ones that have a higher growth rate when compared to companies that don't have the same features.
A Side By Side comparison of Worley's Earnings Growth And 1.5% ROE
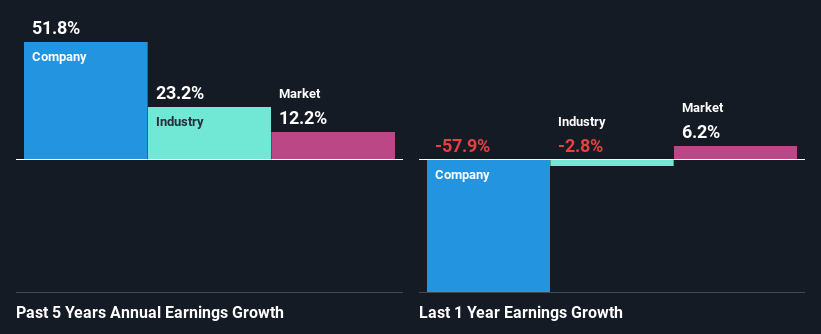
It is hard to argue that Worley's ROE is much good in and of itself. Not just that, even compared to the industry average of 7.4%, the company's ROE is entirely unremarkable. Despite this, surprisingly, Worley saw an exceptional 52% net income growth over the past five years. Therefore, there could be other reasons behind this growth. Such as - high earnings retention or an efficient management in place.
We then compared Worley's net income growth with the industry and we're pleased to see that the company's growth figure is higher when compared with the industry which has a growth rate of 32% in the same period.
Earnings growth is a huge factor in stock valuation. What investors need to determine next is if the expected earnings growth, or the lack of it, is already built into the share price. Doing so will help them establish if the stock's future looks promising or ominous. Has the market priced in the future outlook for WOR? You can find out in our latest intrinsic value infographic research report.
Is Worley Using Its Retained Earnings Effectively?
Worley has a significant three-year median payout ratio of 95%, meaning the company only retains 4.9% of its income. This implies that the company has been able to achieve high earnings growth despite returning most of its profits to shareholders.
Moreover, Worley is determined to keep sharing its profits with shareholders which we infer from its long history of paying a dividend for at least ten years. Existing analyst estimates suggest that the company's future payout ratio is expected to drop to 66% over the next three years. As a result, the expected drop in Worley's payout ratio explains the anticipated rise in the company's future ROE to 7.4%, over the same period.
Conclusion
Overall, we have mixed feelings about Worley. Although the company has shown a pretty impressive growth in earnings, yet the low ROE and the low rate of reinvestment makes us skeptical about the continuity of that growth, especially when or if the business comes to face any threats. With that said, the latest industry analyst forecasts reveal that the company's earnings growth is expected to slow down. Are these analysts expectations based on the broad expectations for the industry, or on the company's fundamentals? Click here to be taken to our analyst's forecasts page for the company.
This article by Simply Wall St is general in nature. It does not constitute a recommendation to buy or sell any stock, and does not take account of your objectives, or your financial situation. We aim to bring you long-term focused analysis driven by fundamental data. Note that our analysis may not factor in the latest price-sensitive company announcements or qualitative material. Simply Wall St has no position in any stocks mentioned.
Have feedback on this article? Concerned about the content? Get in touch with us directly. Alternatively, email editorial-team (at) simplywallst.com.

