Should You Be Worried About Rane Holdings Limited's (NSE:RANEHOLDIN) 8.1% Return On Equity?

One of the best investments we can make is in our own knowledge and skill set. With that in mind, this article will work through how we can use Return On Equity (ROE) to better understand a business. We'll use ROE to examine Rane Holdings Limited (NSE:RANEHOLDIN), by way of a worked example.
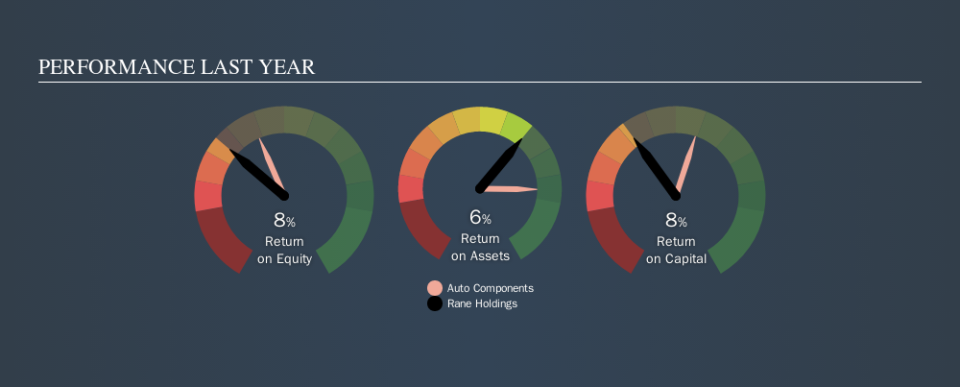
Rane Holdings has a ROE of 8.1%, based on the last twelve months. One way to conceptualize this, is that for each ₹1 of shareholders' equity it has, the company made ₹0.08 in profit.
See our latest analysis for Rane Holdings
How Do I Calculate Return On Equity?
The formula for return on equity is:
Return on Equity = Net Profit ÷ Shareholders' Equity
Or for Rane Holdings:
8.1% = ₹832m ÷ ₹11b (Based on the trailing twelve months to June 2019.)
It's easy to understand the 'net profit' part of that equation, but 'shareholders' equity' requires further explanation. It is the capital paid in by shareholders, plus any retained earnings. Shareholders' equity can be calculated by subtracting the total liabilities of the company from the total assets of the company.
What Does Return On Equity Signify?
ROE looks at the amount a company earns relative to the money it has kept within the business. The 'return' is the yearly profit. A higher profit will lead to a higher ROE. So, all else being equal, a high ROE is better than a low one. Clearly, then, one can use ROE to compare different companies.
Does Rane Holdings Have A Good ROE?
Arguably the easiest way to assess company's ROE is to compare it with the average in its industry. The limitation of this approach is that some companies are quite different from others, even within the same industry classification. If you look at the image below, you can see Rane Holdings has a lower ROE than the average (12%) in the Auto Components industry classification.
That certainly isn't ideal. It is better when the ROE is above industry average, but a low one doesn't necessarily mean the business is overpriced. Nonetheless, it could be useful to double-check if insiders have sold shares recently.
How Does Debt Impact Return On Equity?
Companies usually need to invest money to grow their profits. That cash can come from issuing shares, retained earnings, or debt. In the first two cases, the ROE will capture this use of capital to grow. In the latter case, the use of debt will improve the returns, but will not change the equity. Thus the use of debt can improve ROE, albeit along with extra risk in the case of stormy weather, metaphorically speaking.
Rane Holdings's Debt And Its 8.1% ROE
Although Rane Holdings does use debt, its debt to equity ratio of 0.51 is still low. Its ROE is quite low, and the company already has some debt, so surely shareholders are hoping for an improvement. Conservative use of debt to boost returns is usually a good move for shareholders, though it does leave the company more exposed to interest rate rises.
The Key Takeaway
Return on equity is one way we can compare the business quality of different companies. A company that can achieve a high return on equity without debt could be considered a high quality business. If two companies have around the same level of debt to equity, and one has a higher ROE, I'd generally prefer the one with higher ROE.
But when a business is high quality, the market often bids it up to a price that reflects this. The rate at which profits are likely to grow, relative to the expectations of profit growth reflected in the current price, must be considered, too. You can see how the company has grow in the past by looking at this FREE detailed graph of past earnings, revenue and cash flow.
If you would prefer check out another company -- one with potentially superior financials -- then do not miss thisfree list of interesting companies, that have HIGH return on equity and low debt.
We aim to bring you long-term focused research analysis driven by fundamental data. Note that our analysis may not factor in the latest price-sensitive company announcements or qualitative material.
If you spot an error that warrants correction, please contact the editor at editorial-team@simplywallst.com. This article by Simply Wall St is general in nature. It does not constitute a recommendation to buy or sell any stock, and does not take account of your objectives, or your financial situation. Simply Wall St has no position in the stocks mentioned. Thank you for reading.

