Should You Worry About Akumin Inc.’s (TSE:AKU) ROCE?

Today we are going to look at Akumin Inc. (TSE:AKU) to see whether it might be an attractive investment prospect. To be precise, we'll consider its Return On Capital Employed (ROCE), as that will inform our view of the quality of the business.
First, we'll go over how we calculate ROCE. Then we'll compare its ROCE to similar companies. Finally, we'll look at how its current liabilities affect its ROCE.
Understanding Return On Capital Employed (ROCE)
ROCE measures the amount of pre-tax profits a company can generate from the capital employed in its business. All else being equal, a better business will have a higher ROCE. Ultimately, it is a useful but imperfect metric. Renowned investment researcher Michael Mauboussin has suggested that a high ROCE can indicate that 'one dollar invested in the company generates value of more than one dollar'.
So, How Do We Calculate ROCE?
Analysts use this formula to calculate return on capital employed:
Return on Capital Employed = Earnings Before Interest and Tax (EBIT) ÷ (Total Assets - Current Liabilities)
Or for Akumin:
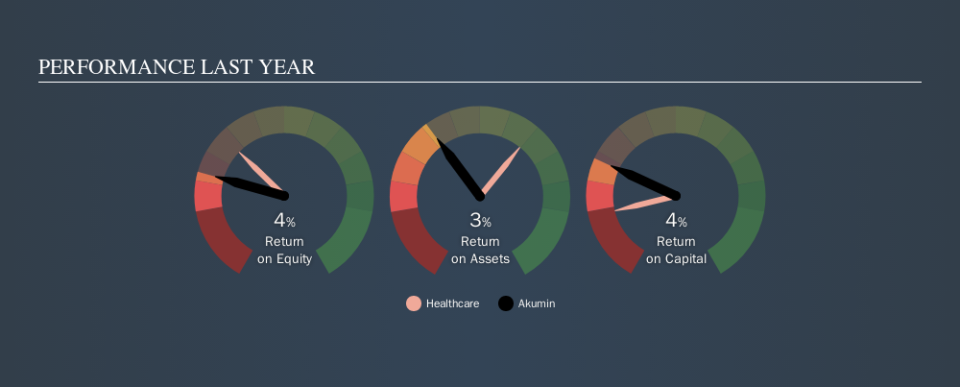
0.042 = US$24m ÷ (US$616m - US$36m) (Based on the trailing twelve months to June 2019.)
Therefore, Akumin has an ROCE of 4.2%.
Check out our latest analysis for Akumin
Does Akumin Have A Good ROCE?
ROCE is commonly used for comparing the performance of similar businesses. In this analysis, Akumin's ROCE appears meaningfully below the 7.9% average reported by the Healthcare industry. This could be seen as a negative, as it suggests some competitors may be employing their capital more efficiently. Regardless of how Akumin stacks up against its industry, its ROCE in absolute terms is quite low (especially compared to a bank account). It is likely that there are more attractive prospects out there.
Akumin has an ROCE of 4.2%, but it didn't have an ROCE 3 years ago, since it was unprofitable. This makes us wonder if the company is improving. You can click on the image below to see (in greater detail) how Akumin's past growth compares to other companies.
It is important to remember that ROCE shows past performance, and is not necessarily predictive. ROCE can be misleading for companies in cyclical industries, with returns looking impressive during the boom times, but very weak during the busts. ROCE is only a point-in-time measure. What happens in the future is pretty important for investors, so we have prepared a free report on analyst forecasts for Akumin.
Akumin's Current Liabilities And Their Impact On Its ROCE
Liabilities, such as supplier bills and bank overdrafts, are referred to as current liabilities if they need to be paid within 12 months. Due to the way ROCE is calculated, a high level of current liabilities makes a company look as though it has less capital employed, and thus can (sometimes unfairly) boost the ROCE. To counteract this, we check if a company has high current liabilities, relative to its total assets.
Akumin has total assets of US$616m and current liabilities of US$36m. Therefore its current liabilities are equivalent to approximately 5.9% of its total assets. Akumin has very few current liabilities, which have a minimal effect on its already low ROCE.
Our Take On Akumin's ROCE
Nevertheless, there are potentially more attractive companies to invest in. You might be able to find a better investment than Akumin. If you want a selection of possible winners, check out this free list of interesting companies that trade on a P/E below 20 (but have proven they can grow earnings).
There are plenty of other companies that have insiders buying up shares. You probably do not want to miss this free list of growing companies that insiders are buying.
We aim to bring you long-term focused research analysis driven by fundamental data. Note that our analysis may not factor in the latest price-sensitive company announcements or qualitative material.
If you spot an error that warrants correction, please contact the editor at editorial-team@simplywallst.com. This article by Simply Wall St is general in nature. It does not constitute a recommendation to buy or sell any stock, and does not take account of your objectives, or your financial situation. Simply Wall St has no position in the stocks mentioned. Thank you for reading.
