Should We Worry About ASM Pacific Technology Limited's (HKG:522) P/E Ratio?

This article is written for those who want to get better at using price to earnings ratios (P/E ratios). We'll show how you can use ASM Pacific Technology Limited's (HKG:522) P/E ratio to inform your assessment of the investment opportunity. What is ASM Pacific Technology's P/E ratio? Well, based on the last twelve months it is 36.1. That corresponds to an earnings yield of approximately 2.8%.
View our latest analysis for ASM Pacific Technology
How Do I Calculate ASM Pacific Technology's Price To Earnings Ratio?
The formula for P/E is:
Price to Earnings Ratio = Share Price ÷ Earnings per Share (EPS)
Or for ASM Pacific Technology:
P/E of 36.1 = HK$88.5 ÷ HK$2.45 (Based on the year to June 2019.)
Is A High Price-to-Earnings Ratio Good?
A higher P/E ratio implies that investors pay a higher price for the earning power of the business. All else being equal, it's better to pay a low price -- but as Warren Buffett said, 'It's far better to buy a wonderful company at a fair price than a fair company at a wonderful price.'
Does ASM Pacific Technology Have A Relatively High Or Low P/E For Its Industry?
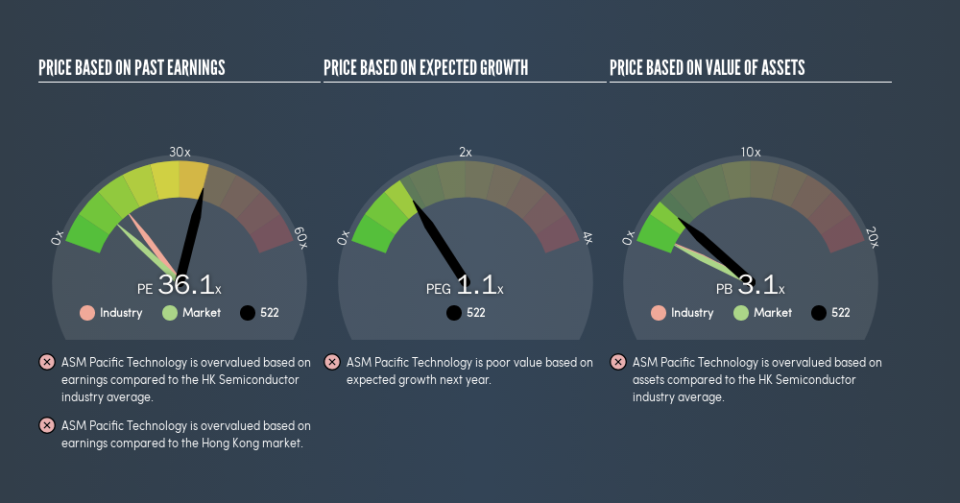
The P/E ratio indicates whether the market has higher or lower expectations of a company. The image below shows that ASM Pacific Technology has a higher P/E than the average (14.3) P/E for companies in the semiconductor industry.
ASM Pacific Technology's P/E tells us that market participants think the company will perform better than its industry peers, going forward. Clearly the market expects growth, but it isn't guaranteed. So investors should always consider the P/E ratio alongside other factors, such as whether company directors have been buying shares.
How Growth Rates Impact P/E Ratios
Probably the most important factor in determining what P/E a company trades on is the earnings growth. If earnings are growing quickly, then the 'E' in the equation will increase faster than it would otherwise. That means unless the share price increases, the P/E will reduce in a few years. A lower P/E should indicate the stock is cheap relative to others -- and that may attract buyers.
ASM Pacific Technology shrunk earnings per share by 63% over the last year. But it has grown its earnings per share by 1.9% per year over the last five years.
Remember: P/E Ratios Don't Consider The Balance Sheet
One drawback of using a P/E ratio is that it considers market capitalization, but not the balance sheet. That means it doesn't take debt or cash into account. In theory, a company can lower its future P/E ratio by using cash or debt to invest in growth.
While growth expenditure doesn't always pay off, the point is that it is a good option to have; but one that the P/E ratio ignores.
ASM Pacific Technology's Balance Sheet
ASM Pacific Technology has net debt worth just 2.3% of its market capitalization. It would probably trade on a higher P/E ratio if it had a lot of cash, but I doubt it is having a big impact.
The Verdict On ASM Pacific Technology's P/E Ratio
ASM Pacific Technology's P/E is 36.1 which is way above average (9.9) in its market. With modest debt but no EPS growth in the last year, it's fair to say the P/E implies some optimism about future earnings, from the market.
Investors should be looking to buy stocks that the market is wrong about. If the reality for a company is better than it expects, you can make money by buying and holding for the long term. So this free visualization of the analyst consensus on future earnings could help you make the right decision about whether to buy, sell, or hold.
Of course, you might find a fantastic investment by looking at a few good candidates. So take a peek at this free list of companies with modest (or no) debt, trading on a P/E below 20.
We aim to bring you long-term focused research analysis driven by fundamental data. Note that our analysis may not factor in the latest price-sensitive company announcements or qualitative material.
If you spot an error that warrants correction, please contact the editor at editorial-team@simplywallst.com. This article by Simply Wall St is general in nature. It does not constitute a recommendation to buy or sell any stock, and does not take account of your objectives, or your financial situation. Simply Wall St has no position in the stocks mentioned. Thank you for reading.
