Should You Worry About Baker Hughes, a GE company’s (NYSE:BHGE) ROCE?

Want to participate in a short research study? Help shape the future of investing tools and you could win a $250 gift card!
Today we'll look at Baker Hughes, a GE company (NYSE:BHGE) and reflect on its potential as an investment. Specifically, we're going to calculate its Return On Capital Employed (ROCE), in the hopes of getting some insight into the business.
First, we'll go over how we calculate ROCE. Next, we'll compare it to others in its industry. Last but not least, we'll look at what impact its current liabilities have on its ROCE.
Return On Capital Employed (ROCE): What is it?
ROCE is a metric for evaluating how much pre-tax income (in percentage terms) a company earns on the capital invested in its business. Generally speaking a higher ROCE is better. Ultimately, it is a useful but imperfect metric. Author Edwin Whiting says to be careful when comparing the ROCE of different businesses, since 'No two businesses are exactly alike.'
So, How Do We Calculate ROCE?
Analysts use this formula to calculate return on capital employed:
Return on Capital Employed = Earnings Before Interest and Tax (EBIT) ÷ (Total Assets - Current Liabilities)
Or for Baker Hughes a GE:
0.033 = US$1.5b ÷ (US$53b - US$9.1b) (Based on the trailing twelve months to March 2019.)
So, Baker Hughes a GE has an ROCE of 3.3%.
See our latest analysis for Baker Hughes a GE
Is Baker Hughes a GE's ROCE Good?
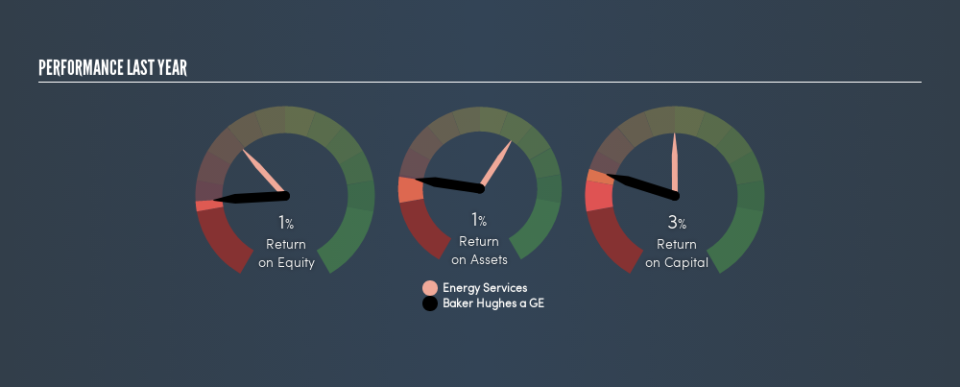
ROCE is commonly used for comparing the performance of similar businesses. Using our data, Baker Hughes a GE's ROCE appears to be significantly below the 8.9% average in the Energy Services industry. This performance is not ideal, as it suggests the company may not be deploying its capital as effectively as some competitors. Regardless of how Baker Hughes a GE stacks up against its industry, its ROCE in absolute terms is quite low (especially compared to a bank account). It is likely that there are more attractive prospects out there.
Baker Hughes a GE's current ROCE of 3.3% is lower than its ROCE in the past, which was 12%, 3 years ago. This makes us wonder if the business is facing new challenges. The image below shows how Baker Hughes a GE's ROCE compares to its industry, and you can click it to see more detail on its past growth.
Remember that this metric is backwards looking - it shows what has happened in the past, and does not accurately predict the future. Companies in cyclical industries can be difficult to understand using ROCE, as returns typically look high during boom times, and low during busts. ROCE is only a point-in-time measure. We note Baker Hughes a GE could be considered a cyclical business. Since the future is so important for investors, you should check out our free report on analyst forecasts for Baker Hughes a GE.
How Baker Hughes a GE's Current Liabilities Impact Its ROCE
Current liabilities are short term bills and invoices that need to be paid in 12 months or less. Due to the way ROCE is calculated, a high level of current liabilities makes a company look as though it has less capital employed, and thus can (sometimes unfairly) boost the ROCE. To counter this, investors can check if a company has high current liabilities relative to total assets.
Baker Hughes a GE has total assets of US$53b and current liabilities of US$9.1b. As a result, its current liabilities are equal to approximately 17% of its total assets. This is a modest level of current liabilities, which will have a limited impact on the ROCE.
Our Take On Baker Hughes a GE's ROCE
While that is good to see, Baker Hughes a GE has a low ROCE and does not look attractive in this analysis. You might be able to find a better investment than Baker Hughes a GE. If you want a selection of possible winners, check out this free list of interesting companies that trade on a P/E below 20 (but have proven they can grow earnings).
If you like to buy stocks alongside management, then you might just love this free list of companies. (Hint: insiders have been buying them).
We aim to bring you long-term focused research analysis driven by fundamental data. Note that our analysis may not factor in the latest price-sensitive company announcements or qualitative material.
If you spot an error that warrants correction, please contact the editor at editorial-team@simplywallst.com. This article by Simply Wall St is general in nature. It does not constitute a recommendation to buy or sell any stock, and does not take account of your objectives, or your financial situation. Simply Wall St has no position in the stocks mentioned. Thank you for reading.
