Should We Worry About Costco Wholesale Corporation’s (NASDAQ:COST) P/E Ratio?

Want to participate in a short research study? Help shape the future of investing tools and receive a $20 prize!
The goal of this article is to teach you how to use price to earnings ratios (P/E ratios). We’ll look at Costco Wholesale Corporation’s (NASDAQ:COST) P/E ratio and reflect on what it tells us about the company’s share price. Costco Wholesale has a price to earnings ratio of 28.96, based on the last twelve months. That means that at current prices, buyers pay $28.96 for every $1 in trailing yearly profits.
See our latest analysis for Costco Wholesale
How Do I Calculate Costco Wholesale’s Price To Earnings Ratio?
The formula for P/E is:
Price to Earnings Ratio = Price per Share ÷ Earnings per Share (EPS)
Or for Costco Wholesale:
P/E of 28.96 = $215.23 ÷ $7.43 (Based on the year to November 2018.)
Is A High P/E Ratio Good?
A higher P/E ratio means that buyers have to pay a higher price for each $1 the company has earned over the last year. That isn’t necessarily good or bad, but a high P/E implies relatively high expectations of what a company can achieve in the future.
How Growth Rates Impact P/E Ratios
Probably the most important factor in determining what P/E a company trades on is the earnings growth. Earnings growth means that in the future the ‘E’ will be higher. That means unless the share price increases, the P/E will reduce in a few years. Then, a lower P/E should attract more buyers, pushing the share price up.
Costco Wholesale increased earnings per share by an impressive 18% over the last twelve months. And earnings per share have improved by 9.3% annually, over the last five years. With that performance, you might expect an above average P/E ratio.
How Does Costco Wholesale’s P/E Ratio Compare To Its Peers?
We can get an indication of market expectations by looking at the P/E ratio. The image below shows that Costco Wholesale has a higher P/E than the average (16.4) P/E for companies in the consumer retailing industry.
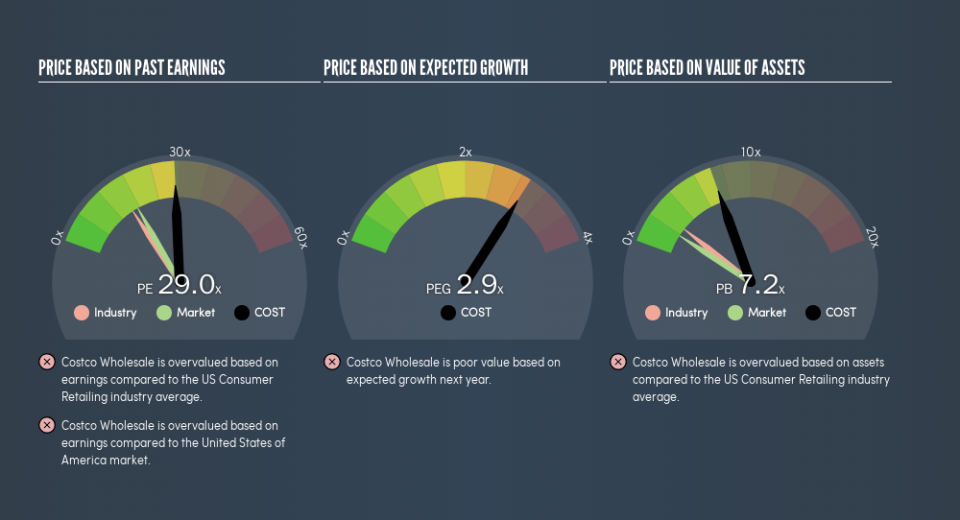
Its relatively high P/E ratio indicates that Costco Wholesale shareholders think it will perform better than other companies in its industry classification. Clearly the market expects growth, but it isn’t guaranteed. So further research is always essential. I often monitor director buying and selling.
A Limitation: P/E Ratios Ignore Debt and Cash In The Bank
It’s important to note that the P/E ratio considers the market capitalization, not the enterprise value. Thus, the metric does not reflect cash or debt held by the company. Hypothetically, a company could reduce its future P/E ratio by spending its cash (or taking on debt) to achieve higher earnings.
Such expenditure might be good or bad, in the long term, but the point here is that the balance sheet is not reflected by this ratio.
How Does Costco Wholesale’s Debt Impact Its P/E Ratio?
Costco Wholesale has net cash of US$1.5b. That should lead to a higher P/E than if it did have debt, because its strong balance sheets gives it more options.
The Bottom Line On Costco Wholesale’s P/E Ratio
Costco Wholesale has a P/E of 29. That’s higher than the average in the US market, which is 17.5. Its net cash position supports a higher P/E ratio, as does its solid recent earnings growth. So it does not seem strange that the P/E is above average.
When the market is wrong about a stock, it gives savvy investors an opportunity. If the reality for a company is better than it expects, you can make money by buying and holding for the long term. So this free visualization of the analyst consensus on future earnings could help you make the right decision about whether to buy, sell, or hold.
Of course you might be able to find a better stock than Costco Wholesale. So you may wish to see this free collection of other companies that have grown earnings strongly.
We aim to bring you long-term focused research analysis driven by fundamental data. Note that our analysis may not factor in the latest price-sensitive company announcements or qualitative material.
If you spot an error that warrants correction, please contact the editor at editorial-team@simplywallst.com. This article by Simply Wall St is general in nature. It does not constitute a recommendation to buy or sell any stock, and does not take account of your objectives, or your financial situation. Simply Wall St has no position in the stocks mentioned. Thank you for reading.

