Should You Worry About Everyman Media Group plc’s (LON:EMAN) ROCE?

Today we'll look at Everyman Media Group plc (LON:EMAN) and reflect on its potential as an investment. In particular, we'll consider its Return On Capital Employed (ROCE), as that can give us insight into how profitably the company is able to employ capital in its business.
First of all, we'll work out how to calculate ROCE. Second, we'll look at its ROCE compared to similar companies. And finally, we'll look at how its current liabilities are impacting its ROCE.
Understanding Return On Capital Employed (ROCE)
ROCE measures the 'return' (pre-tax profit) a company generates from capital employed in its business. Generally speaking a higher ROCE is better. Ultimately, it is a useful but imperfect metric. Renowned investment researcher Michael Mauboussin has suggested that a high ROCE can indicate that 'one dollar invested in the company generates value of more than one dollar'.
How Do You Calculate Return On Capital Employed?
Analysts use this formula to calculate return on capital employed:
Return on Capital Employed = Earnings Before Interest and Tax (EBIT) ÷ (Total Assets - Current Liabilities)
Or for Everyman Media Group:
0.04 = UK£2.9m ÷ (UK£85m - UK£12m) (Based on the trailing twelve months to January 2019.)
So, Everyman Media Group has an ROCE of 4.0%.
Check out our latest analysis for Everyman Media Group
Does Everyman Media Group Have A Good ROCE?
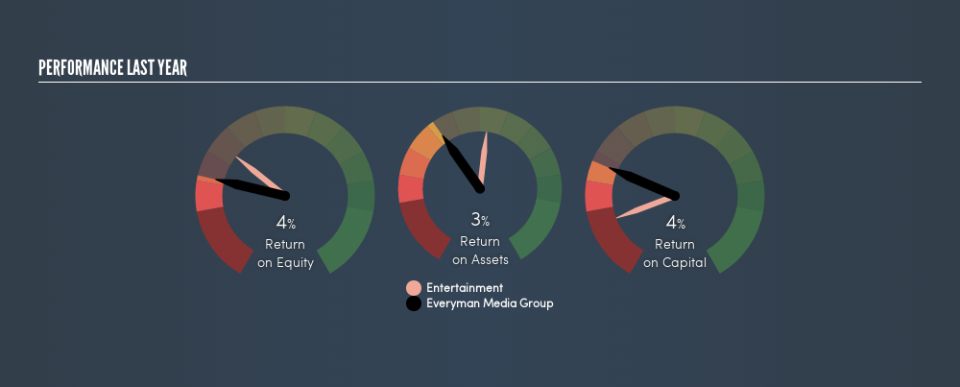
When making comparisons between similar businesses, investors may find ROCE useful. Using our data, Everyman Media Group's ROCE appears to be significantly below the 6.1% average in the Entertainment industry. This could be seen as a negative, as it suggests some competitors may be employing their capital more efficiently. Putting aside Everyman Media Group's performance relative to its industry, its ROCE in absolute terms is poor - considering the risk of owning stocks compared to government bonds. It is likely that there are more attractive prospects out there.
Everyman Media Group delivered an ROCE of 4.0%, which is better than 3 years ago, as was making losses back then. That implies the business has been improving. You can see in the image below how Everyman Media Group's ROCE compares to its industry. Click to see more on past growth.
When considering ROCE, bear in mind that it reflects the past and does not necessarily predict the future. Companies in cyclical industries can be difficult to understand using ROCE, as returns typically look high during boom times, and low during busts. ROCE is, after all, simply a snap shot of a single year. What happens in the future is pretty important for investors, so we have prepared a free report on analyst forecasts for Everyman Media Group.
Everyman Media Group's Current Liabilities And Their Impact On Its ROCE
Current liabilities include invoices, such as supplier payments, short-term debt, or a tax bill, that need to be paid within 12 months. Due to the way ROCE is calculated, a high level of current liabilities makes a company look as though it has less capital employed, and thus can (sometimes unfairly) boost the ROCE. To check the impact of this, we calculate if a company has high current liabilities relative to its total assets.
Everyman Media Group has total liabilities of UK£12m and total assets of UK£85m. Therefore its current liabilities are equivalent to approximately 15% of its total assets. With a very reasonable level of current liabilities, so the impact on ROCE is fairly minimal.
The Bottom Line On Everyman Media Group's ROCE
That's not a bad thing, however Everyman Media Group has a weak ROCE and may not be an attractive investment. But note: make sure you look for a great company, not just the first idea you come across. So take a peek at this free list of interesting companies with strong recent earnings growth (and a P/E ratio below 20).
If you are like me, then you will not want to miss this free list of growing companies that insiders are buying.
We aim to bring you long-term focused research analysis driven by fundamental data. Note that our analysis may not factor in the latest price-sensitive company announcements or qualitative material.
If you spot an error that warrants correction, please contact the editor at editorial-team@simplywallst.com. This article by Simply Wall St is general in nature. It does not constitute a recommendation to buy or sell any stock, and does not take account of your objectives, or your financial situation. Simply Wall St has no position in the stocks mentioned. Thank you for reading.

