Should We Worry About Fu Yu Corporation Limited's (SGX:F13) P/E Ratio?

This article is written for those who want to get better at using price to earnings ratios (P/E ratios). We'll apply a basic P/E ratio analysis to Fu Yu Corporation Limited's (SGX:F13), to help you decide if the stock is worth further research. Fu Yu has a price to earnings ratio of 11.65, based on the last twelve months. That corresponds to an earnings yield of approximately 8.6%.
Want to participate in a short research study? Help shape the future of investing tools and you could win a $250 gift card!
View our latest analysis for Fu Yu
How Do I Calculate A Price To Earnings Ratio?
The formula for P/E is:
Price to Earnings Ratio = Share Price ÷ Earnings per Share (EPS)
Or for Fu Yu:
P/E of 11.65 = SGD0.20 ÷ SGD0.017 (Based on the trailing twelve months to March 2019.)
Is A High P/E Ratio Good?
The higher the P/E ratio, the higher the price tag of a business, relative to its trailing earnings. That isn't a good or a bad thing on its own, but a high P/E means that buyers have a higher opinion of the business's prospects, relative to stocks with a lower P/E.
How Growth Rates Impact P/E Ratios
Generally speaking the rate of earnings growth has a profound impact on a company's P/E multiple. That's because companies that grow earnings per share quickly will rapidly increase the 'E' in the equation. That means unless the share price increases, the P/E will reduce in a few years. A lower P/E should indicate the stock is cheap relative to others -- and that may attract buyers.
In the last year, Fu Yu grew EPS like Taylor Swift grew her fan base back in 2010; the 188% gain was both fast and well deserved. The sweetener is that the annual five year growth rate of 25% is also impressive. With that kind of growth rate we would generally expect a high P/E ratio.
Does Fu Yu Have A Relatively High Or Low P/E For Its Industry?
The P/E ratio essentially measures market expectations of a company. You can see in the image below that the average P/E (8.1) for companies in the machinery industry is lower than Fu Yu's P/E.
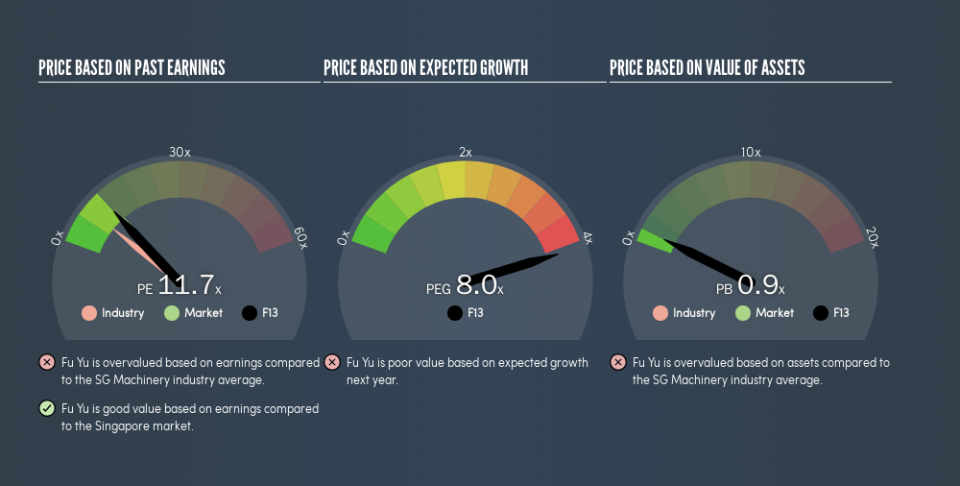
Fu Yu's P/E tells us that market participants think the company will perform better than its industry peers, going forward. The market is optimistic about the future, but that doesn't guarantee future growth. So investors should always consider the P/E ratio alongside other factors, such as whether company directors have been buying shares.
A Limitation: P/E Ratios Ignore Debt and Cash In The Bank
Don't forget that the P/E ratio considers market capitalization. Thus, the metric does not reflect cash or debt held by the company. The exact same company would hypothetically deserve a higher P/E ratio if it had a strong balance sheet, than if it had a weak one with lots of debt, because a cashed up company can spend on growth.
Such spending might be good or bad, overall, but the key point here is that you need to look at debt to understand the P/E ratio in context.
Is Debt Impacting Fu Yu's P/E?
With net cash of S$75m, Fu Yu has a very strong balance sheet, which may be important for its business. Having said that, at 50% of its market capitalization the cash hoard would contribute towards a higher P/E ratio.
The Verdict On Fu Yu's P/E Ratio
Fu Yu's P/E is 11.7 which is about average (12.5) in the SG market. The excess cash it carries is the gravy on top its fast EPS growth. So based on this analysis we'd expect Fu Yu to have a higher P/E ratio.
Investors should be looking to buy stocks that the market is wrong about. If the reality for a company is not as bad as the P/E ratio indicates, then the share price should increase as the market realizes this. So this free report on the analyst consensus forecasts could help you make a master move on this stock.
Of course, you might find a fantastic investment by looking at a few good candidates. So take a peek at this free list of companies with modest (or no) debt, trading on a P/E below 20.
We aim to bring you long-term focused research analysis driven by fundamental data. Note that our analysis may not factor in the latest price-sensitive company announcements or qualitative material.
If you spot an error that warrants correction, please contact the editor at editorial-team@simplywallst.com. This article by Simply Wall St is general in nature. It does not constitute a recommendation to buy or sell any stock, and does not take account of your objectives, or your financial situation. Simply Wall St has no position in the stocks mentioned. Thank you for reading.
