Should We Worry About FVCBankcorp, Inc.'s (NASDAQ:FVCB) P/E Ratio?

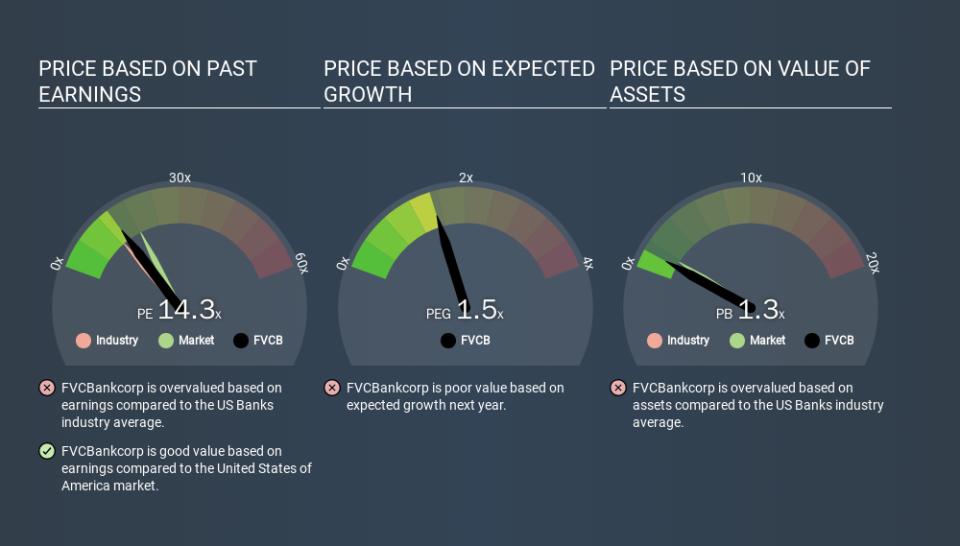
This article is written for those who want to get better at using price to earnings ratios (P/E ratios). We'll show how you can use FVCBankcorp, Inc.'s (NASDAQ:FVCB) P/E ratio to inform your assessment of the investment opportunity. What is FVCBankcorp's P/E ratio? Well, based on the last twelve months it is 14.29. In other words, at today's prices, investors are paying $14.29 for every $1 in prior year profit.
See our latest analysis for FVCBankcorp
How Do You Calculate A P/E Ratio?
The formula for P/E is:
Price to Earnings Ratio = Share Price ÷ Earnings per Share (EPS)
Or for FVCBankcorp:
P/E of 14.29 = USD16.38 ÷ USD1.15 (Based on the trailing twelve months to December 2019.)
Is A High Price-to-Earnings Ratio Good?
A higher P/E ratio implies that investors pay a higher price for the earning power of the business. That isn't necessarily good or bad, but a high P/E implies relatively high expectations of what a company can achieve in the future.
How Does FVCBankcorp's P/E Ratio Compare To Its Peers?
We can get an indication of market expectations by looking at the P/E ratio. You can see in the image below that the average P/E (12.6) for companies in the banks industry is lower than FVCBankcorp's P/E.
FVCBankcorp's P/E tells us that market participants think the company will perform better than its industry peers, going forward. The market is optimistic about the future, but that doesn't guarantee future growth. So investors should always consider the P/E ratio alongside other factors, such as whether company directors have been buying shares.
How Growth Rates Impact P/E Ratios
Earnings growth rates have a big influence on P/E ratios. When earnings grow, the 'E' increases, over time. That means unless the share price increases, the P/E will reduce in a few years. A lower P/E should indicate the stock is cheap relative to others -- and that may attract buyers.
FVCBankcorp increased earnings per share by an impressive 23% over the last twelve months. And it has bolstered its earnings per share by 23% per year over the last five years. So one might expect an above average P/E ratio.
Remember: P/E Ratios Don't Consider The Balance Sheet
Don't forget that the P/E ratio considers market capitalization. That means it doesn't take debt or cash into account. In theory, a company can lower its future P/E ratio by using cash or debt to invest in growth.
Spending on growth might be good or bad a few years later, but the point is that the P/E ratio does not account for the option (or lack thereof).
FVCBankcorp's Balance Sheet
FVCBankcorp has net debt worth just 1.0% of its market capitalization. The market might award it a higher P/E ratio if it had net cash, but its unlikely this low level of net borrowing is having a big impact on the P/E multiple.
The Verdict On FVCBankcorp's P/E Ratio
FVCBankcorp's P/E is 14.3 which is below average (18.6) in the US market. The company does have a little debt, and EPS growth was good last year. The low P/E ratio suggests current market expectations are muted, implying these levels of growth will not continue.
Investors have an opportunity when market expectations about a stock are wrong. If the reality for a company is not as bad as the P/E ratio indicates, then the share price should increase as the market realizes this. So this free report on the analyst consensus forecasts could help you make a master move on this stock.
But note: FVCBankcorp may not be the best stock to buy. So take a peek at this free list of interesting companies with strong recent earnings growth (and a P/E ratio below 20).
If you spot an error that warrants correction, please contact the editor at editorial-team@simplywallst.com. This article by Simply Wall St is general in nature. It does not constitute a recommendation to buy or sell any stock, and does not take account of your objectives, or your financial situation. Simply Wall St has no position in the stocks mentioned.
We aim to bring you long-term focused research analysis driven by fundamental data. Note that our analysis may not factor in the latest price-sensitive company announcements or qualitative material. Thank you for reading.
