Should We Worry About Innovax Holdings Limited's (HKG:2680) P/E Ratio?

Want to participate in a short research study? Help shape the future of investing tools and you could win a $250 gift card!
Today, we'll introduce the concept of the P/E ratio for those who are learning about investing. To keep it practical, we'll show how Innovax Holdings Limited's (HKG:2680) P/E ratio could help you assess the value on offer. Innovax Holdings has a price to earnings ratio of 41.21, based on the last twelve months. In other words, at today's prices, investors are paying HK$41.21 for every HK$1 in prior year profit.
Check out our latest analysis for Innovax Holdings
How Do You Calculate A P/E Ratio?
The formula for price to earnings is:
Price to Earnings Ratio = Price per Share ÷ Earnings per Share (EPS)
Or for Innovax Holdings:
P/E of 41.21 = HK$1.46 ÷ HK$0.035 (Based on the trailing twelve months to February 2019.)
Is A High P/E Ratio Good?
A higher P/E ratio means that buyers have to pay a higher price for each HK$1 the company has earned over the last year. That is not a good or a bad thing per se, but a high P/E does imply buyers are optimistic about the future.
How Growth Rates Impact P/E Ratios
If earnings fall then in the future the 'E' will be lower. That means even if the current P/E is low, it will increase over time if the share price stays flat. A higher P/E should indicate the stock is expensive relative to others -- and that may encourage shareholders to sell.
Innovax Holdings's earnings per share fell by 58% in the last twelve months. And EPS is down 7.5% a year, over the last 5 years. This could justify a pessimistic P/E.
How Does Innovax Holdings's P/E Ratio Compare To Its Peers?
The P/E ratio indicates whether the market has higher or lower expectations of a company. The image below shows that Innovax Holdings has a higher P/E than the average (14.6) P/E for companies in the capital markets industry.
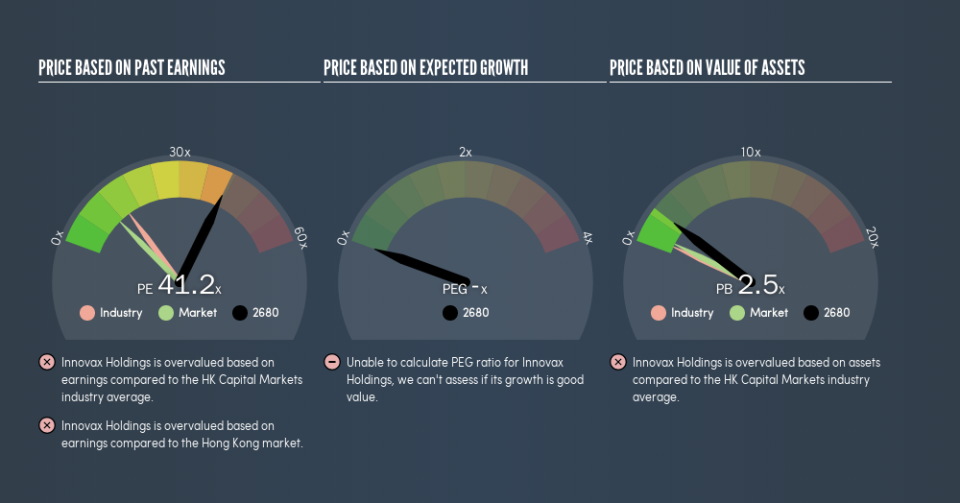
That means that the market expects Innovax Holdings will outperform other companies in its industry. The market is optimistic about the future, but that doesn't guarantee future growth. So investors should always consider the P/E ratio alongside other factors, such as whether company directors have been buying shares.
Don't Forget: The P/E Does Not Account For Debt or Bank Deposits
One drawback of using a P/E ratio is that it considers market capitalization, but not the balance sheet. So it won't reflect the advantage of cash, or disadvantage of debt. Theoretically, a business can improve its earnings (and produce a lower P/E in the future) by investing in growth. That means taking on debt (or spending its cash).
Such spending might be good or bad, overall, but the key point here is that you need to look at debt to understand the P/E ratio in context.
So What Does Innovax Holdings's Balance Sheet Tell Us?
With net cash of HK$217m, Innovax Holdings has a very strong balance sheet, which may be important for its business. Having said that, at 37% of its market capitalization the cash hoard would contribute towards a higher P/E ratio.
The Verdict On Innovax Holdings's P/E Ratio
Innovax Holdings trades on a P/E ratio of 41.2, which is multiples above the HK market average of 10.8. The recent drop in earnings per share might keep value investors away, but the healthy balance sheet means the company retains potential for future growth. If fails to eventuate, the current high P/E could prove to be temporary, as the share price falls.
Investors have an opportunity when market expectations about a stock are wrong. People often underestimate remarkable growth -- so investors can make money when fast growth is not fully appreciated. We don't have analyst forecasts, but you could get a better understanding of its growth by checking out this more detailed historical graph of earnings, revenue and cash flow.
Of course you might be able to find a better stock than Innovax Holdings. So you may wish to see this free collection of other companies that have grown earnings strongly.
We aim to bring you long-term focused research analysis driven by fundamental data. Note that our analysis may not factor in the latest price-sensitive company announcements or qualitative material.
If you spot an error that warrants correction, please contact the editor at editorial-team@simplywallst.com. This article by Simply Wall St is general in nature. It does not constitute a recommendation to buy or sell any stock, and does not take account of your objectives, or your financial situation. Simply Wall St has no position in the stocks mentioned. Thank you for reading.

