Should You Worry About Oceania Healthcare Limited’s (NZSE:OCA) ROCE?

Today we are going to look at Oceania Healthcare Limited (NZSE:OCA) to see whether it might be an attractive investment prospect. Specifically, we're going to calculate its Return On Capital Employed (ROCE), in the hopes of getting some insight into the business.
First of all, we'll work out how to calculate ROCE. Second, we'll look at its ROCE compared to similar companies. Then we'll determine how its current liabilities are affecting its ROCE.
What is Return On Capital Employed (ROCE)?
ROCE measures the amount of pre-tax profits a company can generate from the capital employed in its business. Generally speaking a higher ROCE is better. Overall, it is a valuable metric that has its flaws. Renowned investment researcher Michael Mauboussin has suggested that a high ROCE can indicate that 'one dollar invested in the company generates value of more than one dollar'.
How Do You Calculate Return On Capital Employed?
The formula for calculating the return on capital employed is:
Return on Capital Employed = Earnings Before Interest and Tax (EBIT) ÷ (Total Assets - Current Liabilities)
Or for Oceania Healthcare:
0.0029 = NZ$3.9m ÷ (NZ$1.4b - NZ$81m) (Based on the trailing twelve months to May 2019.)
Therefore, Oceania Healthcare has an ROCE of 0.3%.
See our latest analysis for Oceania Healthcare
Is Oceania Healthcare's ROCE Good?
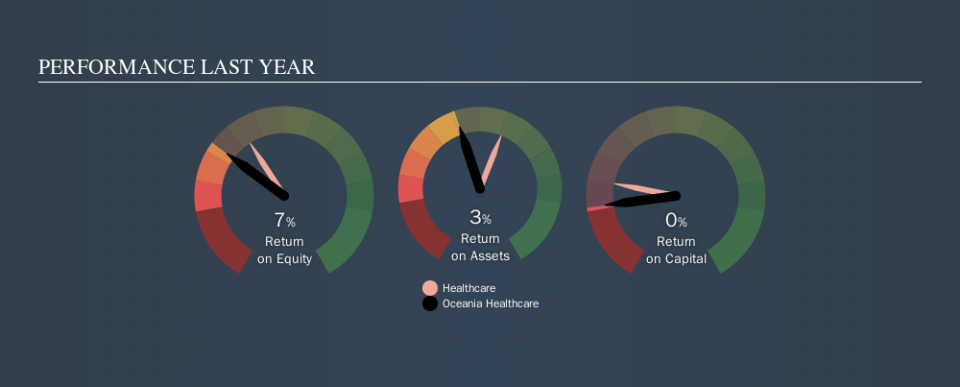
ROCE can be useful when making comparisons, such as between similar companies. We can see Oceania Healthcare's ROCE is meaningfully below the Healthcare industry average of 0.9%. This performance could be negative if sustained, as it suggests the business may underperform its industry. Independently of how Oceania Healthcare compares to its industry, its ROCE in absolute terms is low; especially compared to the ~2.4% available in government bonds. It is likely that there are more attractive prospects out there.
Oceania Healthcare's current ROCE of 0.3% is lower than its ROCE in the past, which was 2.6%, 3 years ago. Therefore we wonder if the company is facing new headwinds. You can click on the image below to see (in greater detail) how Oceania Healthcare's past growth compares to other companies.
It is important to remember that ROCE shows past performance, and is not necessarily predictive. Companies in cyclical industries can be difficult to understand using ROCE, as returns typically look high during boom times, and low during busts. This is because ROCE only looks at one year, instead of considering returns across a whole cycle. Future performance is what matters, and you can see analyst predictions in our free report on analyst forecasts for the company.
Oceania Healthcare's Current Liabilities And Their Impact On Its ROCE
Short term (or current) liabilities, are things like supplier invoices, overdrafts, or tax bills that need to be paid within 12 months. Due to the way ROCE is calculated, a high level of current liabilities makes a company look as though it has less capital employed, and thus can (sometimes unfairly) boost the ROCE. To check the impact of this, we calculate if a company has high current liabilities relative to its total assets.
Oceania Healthcare has total liabilities of NZ$81m and total assets of NZ$1.4b. As a result, its current liabilities are equal to approximately 5.8% of its total assets. Oceania Healthcare has very few current liabilities, which have a minimal effect on its already low ROCE.
Our Take On Oceania Healthcare's ROCE
Still, investors could probably find more attractive prospects with better performance out there. Of course, you might also be able to find a better stock than Oceania Healthcare. So you may wish to see this free collection of other companies that have grown earnings strongly.
If you like to buy stocks alongside management, then you might just love this free list of companies. (Hint: insiders have been buying them).
We aim to bring you long-term focused research analysis driven by fundamental data. Note that our analysis may not factor in the latest price-sensitive company announcements or qualitative material.
If you spot an error that warrants correction, please contact the editor at editorial-team@simplywallst.com. This article by Simply Wall St is general in nature. It does not constitute a recommendation to buy or sell any stock, and does not take account of your objectives, or your financial situation. Simply Wall St has no position in the stocks mentioned. Thank you for reading.

