Should We Worry About Pfeiffer Vacuum Technology AG's (FRA:PFV) P/E Ratio?

Want to participate in a short research study? Help shape the future of investing tools and you could win a $250 gift card!
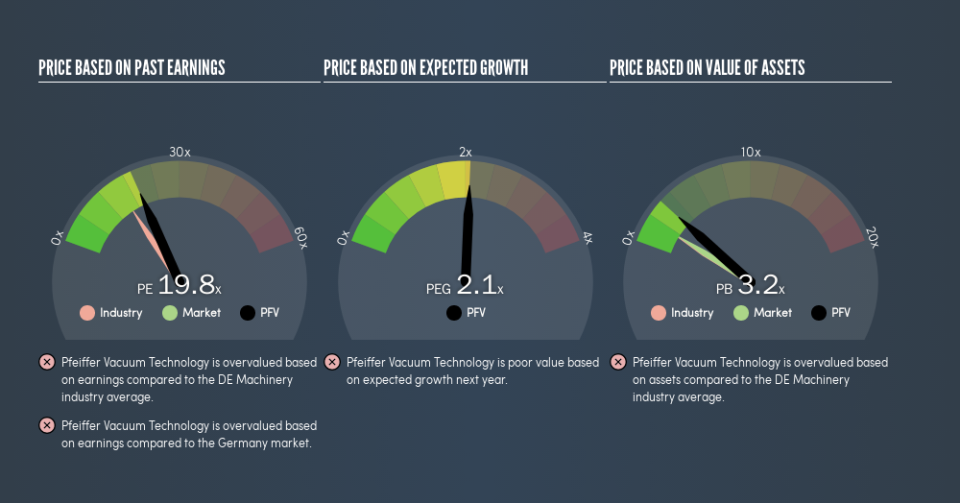
This article is for investors who would like to improve their understanding of price to earnings ratios (P/E ratios). We'll show how you can use Pfeiffer Vacuum Technology AG's (FRA:PFV) P/E ratio to inform your assessment of the investment opportunity. Pfeiffer Vacuum Technology has a P/E ratio of 19.76, based on the last twelve months. That corresponds to an earnings yield of approximately 5.1%.
View our latest analysis for Pfeiffer Vacuum Technology
How Do You Calculate A P/E Ratio?
The formula for price to earnings is:
Price to Earnings Ratio = Share Price ÷ Earnings per Share (EPS)
Or for Pfeiffer Vacuum Technology:
P/E of 19.76 = €124.2 ÷ €6.28 (Based on the trailing twelve months to March 2019.)
Is A High Price-to-Earnings Ratio Good?
The higher the P/E ratio, the higher the price tag of a business, relative to its trailing earnings. All else being equal, it's better to pay a low price -- but as Warren Buffett said, 'It's far better to buy a wonderful company at a fair price than a fair company at a wonderful price.'
How Growth Rates Impact P/E Ratios
Earnings growth rates have a big influence on P/E ratios. If earnings are growing quickly, then the 'E' in the equation will increase faster than it would otherwise. Therefore, even if you pay a high multiple of earnings now, that multiple will become lower in the future. So while a stock may look expensive based on past earnings, it could be cheap based on future earnings.
Pfeiffer Vacuum Technology saw earnings per share improve by -5.2% last year. And its annual EPS growth rate over 5 years is 13%.
How Does Pfeiffer Vacuum Technology's P/E Ratio Compare To Its Peers?
The P/E ratio indicates whether the market has higher or lower expectations of a company. As you can see below, Pfeiffer Vacuum Technology has a higher P/E than the average company (15.8) in the machinery industry.
Pfeiffer Vacuum Technology's P/E tells us that market participants think the company will perform better than its industry peers, going forward. Clearly the market expects growth, but it isn't guaranteed. So investors should always consider the P/E ratio alongside other factors, such as whether company directors have been buying shares.
A Limitation: P/E Ratios Ignore Debt and Cash In The Bank
Don't forget that the P/E ratio considers market capitalization. So it won't reflect the advantage of cash, or disadvantage of debt. The exact same company would hypothetically deserve a higher P/E ratio if it had a strong balance sheet, than if it had a weak one with lots of debt, because a cashed up company can spend on growth.
While growth expenditure doesn't always pay off, the point is that it is a good option to have; but one that the P/E ratio ignores.
Is Debt Impacting Pfeiffer Vacuum Technology's P/E?
Pfeiffer Vacuum Technology has net cash of €35m. That should lead to a higher P/E than if it did have debt, because its strong balance sheets gives it more options.
The Verdict On Pfeiffer Vacuum Technology's P/E Ratio
Pfeiffer Vacuum Technology trades on a P/E ratio of 19.8, which is fairly close to the DE market average of 19.5. Recent earnings growth wasn't bad. Also positive, the relatively strong balance sheet will allow for investment in growth. If this occurs the current P/E might prove to signify undervaluation.
Investors have an opportunity when market expectations about a stock are wrong. People often underestimate remarkable growth -- so investors can make money when fast growth is not fully appreciated. So this free visual report on analyst forecasts could hold the key to an excellent investment decision.
Of course you might be able to find a better stock than Pfeiffer Vacuum Technology. So you may wish to see this free collection of other companies that have grown earnings strongly.
We aim to bring you long-term focused research analysis driven by fundamental data. Note that our analysis may not factor in the latest price-sensitive company announcements or qualitative material.
If you spot an error that warrants correction, please contact the editor at editorial-team@simplywallst.com. This article by Simply Wall St is general in nature. It does not constitute a recommendation to buy or sell any stock, and does not take account of your objectives, or your financial situation. Simply Wall St has no position in the stocks mentioned. Thank you for reading.
