Should We Worry About Think Childcare Limited’s (ASX:TNK) P/E Ratio?

Want to participate in a short research study? Help shape the future of investing tools and you could win a $250 gift card!
The goal of this article is to teach you how to use price to earnings ratios (P/E ratios). We’ll show how you can use Think Childcare Limited’s (ASX:TNK) P/E ratio to inform your assessment of the investment opportunity. Think Childcare has a price to earnings ratio of 20.1, based on the last twelve months. That means that at current prices, buyers pay A$20.1 for every A$1 in trailing yearly profits.
See our latest analysis for Think Childcare
How Do I Calculate A Price To Earnings Ratio?
The formula for P/E is:
Price to Earnings Ratio = Price per Share ÷ Earnings per Share (EPS)
Or for Think Childcare:
P/E of 20.1 = A$1.8 ÷ A$0.090 (Based on the trailing twelve months to June 2018.)
Is A High P/E Ratio Good?
A higher P/E ratio means that investors are paying a higher price for each A$1 of company earnings. That isn’t necessarily good or bad, but a high P/E implies relatively high expectations of what a company can achieve in the future.
How Growth Rates Impact P/E Ratios
P/E ratios primarily reflect market expectations around earnings growth rates. When earnings grow, the ‘E’ increases, over time. That means unless the share price increases, the P/E will reduce in a few years. A lower P/E should indicate the stock is cheap relative to others — and that may attract buyers.
Think Childcare saw earnings per share decrease by 42% last year. But EPS is up 57% over the last 5 years.
How Does Think Childcare’s P/E Ratio Compare To Its Peers?
We can get an indication of market expectations by looking at the P/E ratio. You can see in the image below that the average P/E (18.5) for companies in the consumer services industry is lower than Think Childcare’s P/E.
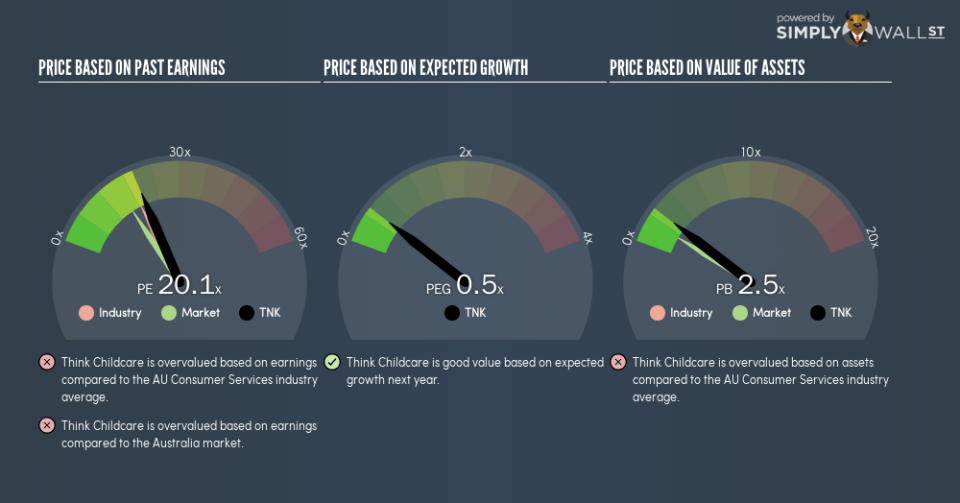
That means that the market expects Think Childcare will outperform other companies in its industry. Clearly the market expects growth, but it isn’t guaranteed. So investors should delve deeper. I like to check if company insiders have been buying or selling.
Remember: P/E Ratios Don’t Consider The Balance Sheet
The ‘Price’ in P/E reflects the market capitalization of the company. That means it doesn’t take debt or cash into account. Hypothetically, a company could reduce its future P/E ratio by spending its cash (or taking on debt) to achieve higher earnings.
Such expenditure might be good or bad, in the long term, but the point here is that the balance sheet is not reflected by this ratio.
Think Childcare’s Balance Sheet
Net debt totals 19% of Think Childcare’s market cap. This could bring some additional risk, and reduce the number of investment options for management; worth remembering if you compare its P/E to businesses without debt.
The Bottom Line On Think Childcare’s P/E Ratio
Think Childcare’s P/E is 20.1 which is above average (15.7) in the AU market. With a bit of debt, but a lack of recent growth, it’s safe to say the market is expecting improved profit performance from the company, in the next few years.
When the market is wrong about a stock, it gives savvy investors an opportunity. As value investor Benjamin Graham famously said, ‘In the short run, the market is a voting machine but in the long run, it is a weighing machine.’ So this free visualization of the analyst consensus on future earnings could help you make the right decision about whether to buy, sell, or hold.
Of course, you might find a fantastic investment by looking at a few good candidates. So take a peek at this free list of companies with modest (or no) debt, trading on a P/E below 20.
To help readers see past the short term volatility of the financial market, we aim to bring you a long-term focused research analysis purely driven by fundamental data. Note that our analysis does not factor in the latest price-sensitive company announcements.
The author is an independent contributor and at the time of publication had no position in the stocks mentioned. For errors that warrant correction please contact the editor at editorial-team@simplywallst.com.

