Should We Worry About Unibel S.A.'s (EPA:UNBL) P/E Ratio?

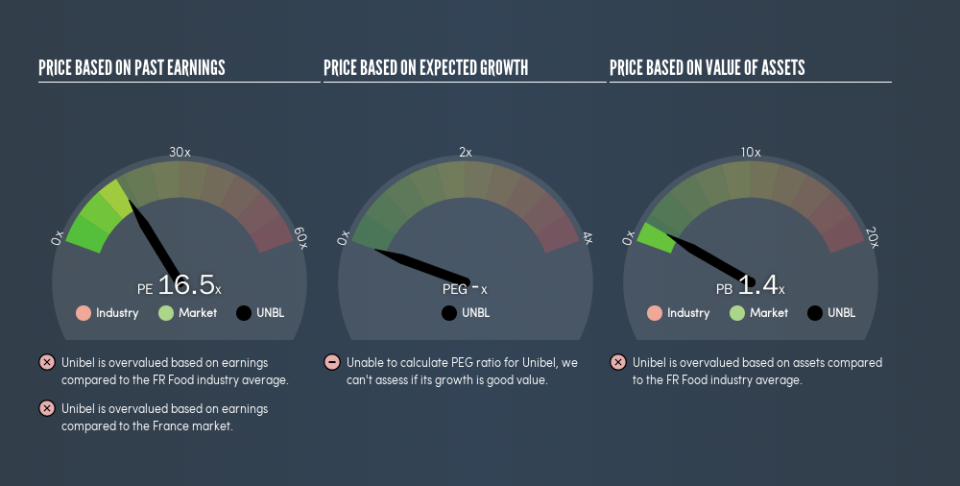
Today, we'll introduce the concept of the P/E ratio for those who are learning about investing. We'll apply a basic P/E ratio analysis to Unibel S.A.'s (EPA:UNBL), to help you decide if the stock is worth further research. What is Unibel's P/E ratio? Well, based on the last twelve months it is 16.52. In other words, at today's prices, investors are paying €16.52 for every €1 in prior year profit.
See our latest analysis for Unibel
How Do You Calculate A P/E Ratio?
The formula for price to earnings is:
Price to Earnings Ratio = Price per Share ÷ Earnings per Share (EPS)
Or for Unibel:
P/E of 16.52 = €765 ÷ €46.31 (Based on the trailing twelve months to December 2018.)
Is A High Price-to-Earnings Ratio Good?
A higher P/E ratio means that buyers have to pay a higher price for each €1 the company has earned over the last year. That is not a good or a bad thing per se, but a high P/E does imply buyers are optimistic about the future.
How Growth Rates Impact P/E Ratios
If earnings fall then in the future the 'E' will be lower. That means unless the share price falls, the P/E will increase in a few years. So while a stock may look cheap based on past earnings, it could be expensive based on future earnings.
Unibel's earnings per share fell by 16% in the last twelve months. But it has grown its earnings per share by 3.6% per year over the last five years. And EPS is down 6.9% a year, over the last 3 years. This growth rate might warrant a low P/E ratio.
How Does Unibel's P/E Ratio Compare To Its Peers?
The P/E ratio indicates whether the market has higher or lower expectations of a company. The image below shows that Unibel has a P/E ratio that is roughly in line with the food industry average (16.1).
Its P/E ratio suggests that Unibel shareholders think that in the future it will perform about the same as other companies in its industry classification. The company could surprise by performing better than average, in the future. Checking factors such as the tenure of the board and management could help you form your own view on if that will happen.
A Limitation: P/E Ratios Ignore Debt and Cash In The Bank
One drawback of using a P/E ratio is that it considers market capitalization, but not the balance sheet. In other words, it does not consider any debt or cash that the company may have on the balance sheet. In theory, a company can lower its future P/E ratio by using cash or debt to invest in growth.
Spending on growth might be good or bad a few years later, but the point is that the P/E ratio does not account for the option (or lack thereof).
How Does Unibel's Debt Impact Its P/E Ratio?
Net debt is 38% of Unibel's market cap. While that's enough to warrant consideration, it doesn't really concern us.
The Verdict On Unibel's P/E Ratio
Unibel's P/E is 16.5 which is about average (16) in the FR market. Given it has some debt, but didn't grow last year, the P/E indicates the market is expecting higher profits ahead for the business.
Investors should be looking to buy stocks that the market is wrong about. If the reality for a company is better than it expects, you can make money by buying and holding for the long term. Although we don't have analyst forecasts, you might want to assess this data-rich visualization of earnings, revenue and cash flow.
You might be able to find a better buy than Unibel. If you want a selection of possible winners, check out this free list of interesting companies that trade on a P/E below 20 (but have proven they can grow earnings).
We aim to bring you long-term focused research analysis driven by fundamental data. Note that our analysis may not factor in the latest price-sensitive company announcements or qualitative material.
If you spot an error that warrants correction, please contact the editor at editorial-team@simplywallst.com. This article by Simply Wall St is general in nature. It does not constitute a recommendation to buy or sell any stock, and does not take account of your objectives, or your financial situation. Simply Wall St has no position in the stocks mentioned. Thank you for reading.
