Worst Places To Spend Your Golden Years and Where To Retire Instead

Once you reach retirement, your bills start to take on a new meaning. Every dollar of your nest egg is one you can’t spend on traveling the world, buying a boat or even leaving your dang job a few years early. For those of you with plans to relocate in retirement, your biggest concern might be finding a place that’s both affordable and desirable.
That’s why GOBankingRates identified one location in every state that will eat away your savings fast, and one burg that can provide you a welcome respite from unbearable bills.
The study took every city in the United States with a population of at least 25,000 residents, of whom at least 16% are over the age of 65. Those cities were then scored based on their cost of living, their livability score per AreaVibes and how much of the population are senior citizens.
Related: Avoid These 30 States in Retirement If You Want To Keep Your Money
Home values sourced from Zillow’s Home Value Index — an index that uses adjustments for seasonality to give a broader sense of area home values — were also accounted for in the final ranking. Lower values scored higher to reflect the needs of retirees in the housing market.
After combining all of these scores, the study highlighted which city scored the worst in each state — save for Vermont and Alaska, which didn’t have enough cities that fit the criteria — and which had the best combination of livability and low costs.
See which community in your state you should avoid when you’re getting ready to hang it up, and which one might help you live a richer and more fulfilling retirement.
Last updated: Jan. 15, 2021

Alabama
Worst place to retire: Athens
Percentage of population over 65: 18
Average home value: $172,435
Annual expenditures: $42,547
Livability score: 66
Where to retire instead: Decatur
Percentage of population over 65: 17.8
Average home value: $126,373
Annual expenditures: $39,048
Livability score: 74
See: 29 Brilliant Retirement Ideas for Any Age

Arizona
Worst place to retire: Catalina Foothills
Percentage of population over 65: 30.6
Average home value: $543,127
Annual expenditures: $66,281
Livability score: 78
Where to retire instead: Sun City
Percentage of population over 65: 75.9
Average home value: $212,675
Annual expenditures: $48,126
Livability score: 75
Find Out: Exactly How Much Savings You Need To Retire In Your State

Arkansas
Worst place to retire: Texarkana
Percentage of population over 65: 17.2
Average home value: $103,985
Annual expenditures: $37,730
Livability score: 57
Where to retire instead: Bella Vista
Percentage of population over 65: 32.1
Average home value: $192,240
Annual expenditures: $45,996
Livability score: 80

California
Worst place to retire: Beverly Hills
Percentage of population over 65: 21.6
Average home value: $5,322,834
Annual expenditures: $276,989
Livability score: 77
Where to retire instead: Roseville
Percentage of population over 65: 16.7
Average home value: $501,188
Annual expenditures: $67,903
Livability score: 77
Read: 35 Retirement Planning Mistakes That Waste Your Money

Colorado
Worst place to retire: Littleton
Percentage of population over 65: 17.2
Average home value: $509,525
Annual expenditures: $66,078
Livability score: 76
Where to retire instead: Loveland
Percentage of population over 65: 18.9
Average home value: $385,067
Annual expenditures: $58,015
Livability score: 77

Connecticut
Worst place to retire: Westport
Percentage of population over 65: 16.3
Average home value: $1,093,064
Annual expenditures: $116,840
Livability score: 84
Where to retire instead: Newington
Percentage of population over 65: 21.3
Average home value: $239,827
Annual expenditures: $52,284
Livability score: 83
Delaware
Worst place to retire: Milford
Percentage of population over 65: 20
Average home value: $234,341
Annual expenditures: $47,061
Livability score: 57
Where to retire instead: Hockessin
Percentage of population over 65: 23.6
Average home value: $437,261
Annual expenditures: $66,433
Livability score: 76

Florida
Worst place to retire: Miami Beach
Percentage of population over 65: 16.6
Average home value: $1,404,117
Annual expenditures: $63,897
Livability score: 69
Where to retire instead: The Villages
Percentage of population over 65: 79.7
Average home value: $297,253
Annual expenditures: $52,436
Livability score: 79

Georgia
Worst place to retire: Snellville
Percentage of population over 65: 16.7
Average home value: $222,165
Annual expenditures: $49,546
Livability score: 69
Where to retire instead: Peachtree City
Percentage of population over 65: 17.2
Average home value: $359,500
Annual expenditures: $59,536
Livability score: 88

Hawaii
Worst place to retire: Waipahu
Percentage of population over 65: 17.6
Average home value: $706,318
Annual expenditures: $92,296
Livability score: 63
Where to retire instead: Urban Honolulu
Percentage of population over 65: 19.7
Average home value: $977,511
Annual expenditures: $89,507
Livability score: 69

Idaho
Worst place to retire: Coeur d’Alene
Percentage of population over 65: 16.9
Average home value: $367,942
Annual expenditures: $53,856
Livability score: 77
Where to retire instead: Lewiston
Percentage of population over 65: 19.7
Average home value: $259,887
Annual expenditures: $48,227
Livability score: 79

Illinois
Worst place to retire: Wilmette
Percentage of population over 65: 18.8
Average home value: $727,556
Annual expenditures: $80,683
Livability score: 83
Where to retire instead: Huntley
Percentage of population over 65: 31
Average home value: $271,615
Annual expenditures: $56,747
Livability score: 81

Indiana
Worst place to retire: Valparaiso
Percentage of population over 65: 17.2
Average home value: $243,052
Annual expenditures: $50,509
Livability score: 86
Where to retire instead: Kokomo
Percentage of population over 65: 18.6
Average home value: $106,664
Annual expenditures: $37,425
Livability score: 72
Check Out: The Best Places To Retire in America Are All College Towns
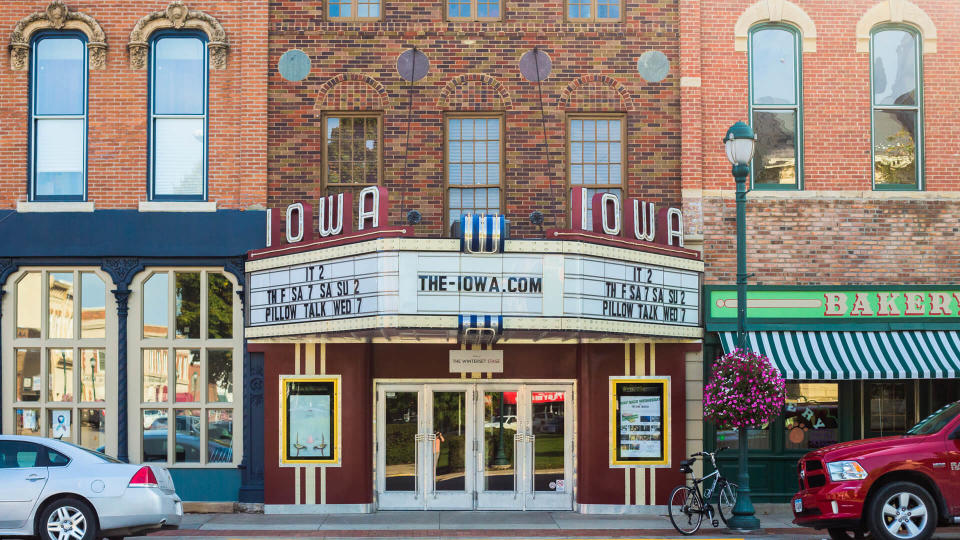
Iowa
Worst place to retire: Bettendorf
Percentage of population over 65: 16.3
Average home value: $231,899
Annual expenditures: $47,010
Livability score: 86
Where to retire instead: Burlington
Percentage of population over 65: 19.8
Average home value: $91,419
Annual expenditures: $36,614
Livability score: 74

Kansas
Worst place to retire: Topeka
Percentage of population over 65: 16.8
Average home value: $126,849
Annual expenditures: $40,062
Livability score: 60
Where to retire instead: Hutchinson
Percentage of population over 65: 18.2
Average home value: $100,009
Annual expenditures: $37,324
Livability score: 69

Kentucky
Worst place to retire: Florence
Percentage of population over 65: 16.3
Average home value: $204,031
Annual expenditures: $45,692
Livability score: 70
Where to retire instead: Henderson
Percentage of population over 65: 17.9
Average home value: $122,500
Annual expenditures: $41,381
Livability score: 86

Louisiana
Worst place to retire: Marrero
Percentage of population over 65: 16.5
Average home value: $158,922
Annual expenditures: $45,032
Livability score: 66
Where to retire instead: Metairie
Percentage of population over 65: 18.9
Average home value: $274,068
Annual expenditures: $51,422
Livability score: 84

Maine
Worst place to retire: South Portland
Percentage of population over 65: 16.3
Average home value: $330,699
Annual expenditures: $54,059
Livability score: 75
Where to retire instead: Lewiston
Percentage of population over 65: 18.2
Average home value: $164,571
Annual expenditures: $43,207
Livability score: 71

Maryland
Worst place to retire: Lochearn
Percentage of population over 65: 19
Average home value: $216,495
Annual expenditures: $51,980
Livability score: 62
Where to retire instead: Pikesville
Percentage of population over 65: 25
Average home value: $383,726
Annual expenditures: $58,826
Livability score: 73

Massachusetts
Worst place to retire: Belmont
Percentage of population over 65: 16.7
Average home value: $1,217,636
Annual expenditures: $105,329
Livability score: 89
Where to retire instead: Peabody
Percentage of population over 65: 21.7
Average home value: $485,563
Annual expenditures: $65,723
Livability score: 76

Michigan
Worst place to retire: Rochester Hills
Percentage of population over 65: 17.7
Average home value: $355,307
Annual expenditures: $59,079
Livability score: 88
Where to retire instead: Livonia
Percentage of population over 65: 19.5
Average home value: $226,386
Annual expenditures: $50,306
Livability score: 90
Minnesota
Worst place to retire: Maplewood
Percentage of population over 65: 16.2
Average home value: $273,074
Annual expenditures: $51,777
Livability score: 76
Where to retire instead: Bloomington
Percentage of population over 65: 19.2
Average home value: $309,338
Annual expenditures: $53,197
Livability score: 84

Mississippi
Worst place to retire: Laurel
Percentage of population over 65: 16.1
Average home value: $97,318
Annual expenditures: $39,048
Livability score: 63
Where to retire instead: Brandon
Percentage of population over 65: 17.1
Average home value: $200,026
Annual expenditures: $47,010
Livability score: 81

Missouri
Worst place to retire: Cape Girardeau
Percentage of population over 65: 16.3
Average home value: $139,577
Annual expenditures: $41,837
Livability score: 69
Where to retire instead: Independence
Percentage of population over 65: 17.9
Average home value: $132,962
Annual expenditures: $42,598
Livability score: 75

Montana
Worst place to retire: Helena
Percentage of population over 65: 19
Average home value: $292,272
Annual expenditures: $48,024
Livability score: 58
Where to retire instead: Great Falls
Percentage of population over 65: 18.1
Average home value: $200,165
Annual expenditures: $45,793
Livability score: 69

Nebraska
Worst place to retire: Columbus
Percentage of population over 65: 16.5
Average home value: $165,220
Annual expenditures: $42,243
Livability score: 90
Where to retire instead: Hastings
Percentage of population over 65: 17
Average home value: $130,052
Annual expenditures: $40,265
Livability score: 91

Nevada
Worst place to retire: Carson City
Percentage of population over 65: 19.6
Average home value: $350,985
Annual expenditures: $55,682
Livability score: 70
Where to retire instead: Pahrump
Percentage of population over 65: 32
Average home value: $259,199
Annual expenditures: $46,148
Livability score: 65
Also See: 20 Best Suburbs for Retirees

New Hampshire
Worst place to retire: Portsmouth
Percentage of population over 65: 18.1
Average home value: $525,657
Annual expenditures: $64,709
Livability score: 87
Where to retire instead: Keene
Percentage of population over 65: 17.4
Average home value: $193,104
Annual expenditures: $44,576
Livability score: 78

New Jersey
Worst place to retire: Princeton
Percentage of population over 65: 16.3
Average home value: $831,621
Annual expenditures: $98,686
Livability score: 85
Where to retire instead: Toms River
Percentage of population over 65: 18.9
Average home value: $247,342
Annual expenditures: $53,653
Livability score: 73

New Mexico
Worst place to retire: South Valley
Percentage of population over 65: 16.1
Average home value: $165,010
Annual expenditures: $43,409
Livability score: 56
Where to retire instead: Alamogordo
Percentage of population over 65: 17.4
Average home value: $135,883
Annual expenditures: $38,288
Livability score: 72
New York
Worst place to retire: White Plains
Percentage of population over 65: 16.8
Average home value: $653,434
Annual expenditures: $86,160
Livability score: 64
Where to retire instead: West Seneca
Percentage of population over 65: 20.5
Average home value: $181,341
Annual expenditures: $44,525
Livability score: 87

North Carolina
Worst place to retire: Salisbury
Percentage of population over 65: 17.5
Average home value: $163,712
Annual expenditures: $43,156
Livability score: 58
Where to retire instead: New Bern
Percentage of population over 65: 19.8
Average home value: $166,314
Annual expenditures: $41,533
Livability score: 67

North Dakota
Worst place to retire: Jamestown
Percentage of population over 65: 18.4
Average home value: $167,534
Annual expenditures: $41,432
Livability score: 79
Where to retire instead: Bismarck
Percentage of population over 65: 16.7
Average home value: $295,672
Annual expenditures: $49,241
Livability score: 80

Ohio
Worst place to retire: Garfield Heights
Percentage of population over 65: 16.9
Average home value: $77,598
Annual expenditures: $37,273
Livability score: 61
Where to retire instead: Mentor
Percentage of population over 65: 21.7
Average home value: $206,382
Annual expenditures: $45,134
Livability score: 92

Oklahoma
Worst place to retire: Ponca City
Percentage of population over 65: 17.8
Average home value: $71,292
Annual expenditures: $38,693
Livability score: 66
Where to retire instead: Bartlesville
Percentage of population over 65: 18.8
Average home value: $110,044
Annual expenditures: $40,570
Livability score: 80

Oregon
Worst place to retire: McMinnville
Percentage of population over 65: 17.7
Average home value: $347,544
Annual expenditures: $56,747
Livability score: 70
Where to retire instead: Grants Pass
Percentage of population over 65: 19.3
Average home value: $312,808
Annual expenditures: $49,698
Livability score: 69
Don’t Miss: 20 Amazing Ways To Live Life to the Fullest When You Retire

Pennsylvania
Worst place to retire: Monroeville
Percentage of population over 65: 22.4
Average home value: $159,636
Annual expenditures: $45,286
Livability score: 78
Where to retire instead: Bethel Park
Percentage of population over 65: 23
Average home value: $227,596
Annual expenditures: $49,546
Livability score: 93

Rhode Island
Worst place to retire: Newport
Percentage of population over 65: 17.3
Average home value: $584,677
Annual expenditures: $68,106
Livability score: 68
Where to retire instead: Warwick
Percentage of population over 65: 19.8
Average home value: $254,390
Annual expenditures: $51,473
Livability score: 72

South Carolina
Worst place to retire: Myrtle Beach
Percentage of population over 65: 20.1
Average home value: $264,890
Annual expenditures: $43,004
Livability score: 60
Where to retire instead: Aiken
Percentage of population over 65: 25.9
Average home value: $179,207
Annual expenditures: $43,460
Livability score: 74

South Dakota
Worst place to retire: Rapid City
Percentage of population over 65: 17.6
Average home value: $213,746
Annual expenditures: $47,111
Livability score: 69
Where to retire instead: Watertown
Percentage of population over 65: 116.8
Average home value: $206,744
Annual expenditures: $41,533
Livability score: 82

Tennessee
Worst place to retire: Morristown
Percentage of population over 65: 16.7
Average home value: $136,677
Annual expenditures: $41,432
Livability score: 65
Where to retire instead: Kingsport
Percentage of population over 65: 22.9
Average home value: $143,468
Annual expenditures: $41,482
Livability score: 72

Texas
Worst place to retire: Colleyville
Percentage of population over 65: 16.2
Average home value: $585,773
Annual expenditures: $72,772
Livability score: 91
Where to retire instead: Georgetown
Percentage of population over 65: 29.4
Average home value: $325,549
Annual expenditures: $54,921
Livability score: 86

Utah
Worst place to retire: Murray
Percentage of population over 65: 16.2
Average home value: $393,884
Annual expenditures: $57,254
Livability score: 69
Where to retire instead: St. George
Percentage of population over 65: 22.1
Average home value: $344,886
Annual expenditures: $52,538
Livability score: 74
Look: 29 Brilliant Retirement Ideas for Any Age

Virginia
Worst place to retire: Petersburg
Percentage of population over 65: 16.4
Average home value: $132,117
Annual expenditures: $40,671
Livability score: 61
Where to retire instead: Danville
Percentage of population over 65: 20.1
Average home value: $86,179
Annual expenditures: $36,259
Livability score: 85

Washington
Worst place to retire: Walla Walla
Percentage of population over 65: 16.5
Average home value: $283,169
Annual expenditures: $47,314
Livability score: 59
Where to retire instead: Longview
Percentage of population over 65: 21.2
Average home value: $281,551
Annual expenditures: $48,886
Livability score: 81
West Virginia
Worst place to retire: Charleston
Percentage of population over 65: 18
Average home value: $118,897
Annual expenditures: $39,809
Livability score: 63
Where to retire instead: Wheeling
Percentage of population over 65: 22.1
Average home value: $101,500
Annual expenditures: $38,490
Livability score: 72

Wisconsin
Worst place to retire: Franklin
Percentage of population over 65: 17.2
Average home value: $300,955
Annual expenditures: $53,704
Livability score: 85
Where to retire instead: New Berlin
Percentage of population over 65: 21.2
Average home value: $310,727
Annual expenditures: $54,921
Livability score: 88

Wyoming
Worst place to retire: Riverton
Percentage of population over 65: 16.1
Average home value: $193,893
Annual expenditures: $47,162
Livability score: 66
Where to retire instead: Sheridan
Percentage of population over 65: 18.5
Average home value: $282,503
Annual expenditures: $49,393
Livability score: 82
More From GOBankingRates
36 Ways To Save For Your Emergency Fund and Any Unexpected Situations
25 Tips and Tricks for Buying a Car Online During the Pandemic
Methodology: In order to find the worst places to spend your golden years and where to retire instead, GOBankingRates first found every city in each state that had both a population over 25,000 and a population of people 65 years and older over 16% (the national average) of the total population as sourced from the 2018 American Community Survey conducted by the U.S. Census Bureau. Once these cities were identified for each state, GOBankingRates scored them across the following factors: (1) population over 65 as sourced from the 2018 American Community Survey; (2) percent of total population 65 years and older as sourced from the 2018 American Community Survey; (3) the 2020 average single-family residence Zillow Home Value Index as sourced from Zillow’s housing data through May 2020; (4) annual expenditures for a person 65 and older using the Bureau of Labor Statistic’s consumer expenditure survey for July 2018 through June 2019, which was then factored out for each city using a cost of living index sourced from Sperling’s Best Places; and (5) a livability score out of 100 as sourced from AreaVibes. All factors were then scored and combined with the lowest score being best. Once all scores were tabulated the qualifying city with the highest overall score was deemed that state’s “worst place to spend your golden years” and the city with the lowest score was deemed “where to retire to instead.” For some smaller states, the population requirement was lowered, however, both Alaska and Vermont did not have enough cities to be included in the final list. All data was collected and is up to date as of July 2, 2020.
This article originally appeared on GOBankingRates.com: Worst Places To Spend Your Golden Years and Where To Retire Instead

