Do You Like Yangarra Resources Ltd. (TSE:YGR) At This P/E Ratio?

This article is for investors who would like to improve their understanding of price to earnings ratios (P/E ratios). To keep it practical, we'll show how Yangarra Resources Ltd.'s (TSE:YGR) P/E ratio could help you assess the value on offer. Looking at earnings over the last twelve months, Yangarra Resources has a P/E ratio of 9.05. That corresponds to an earnings yield of approximately 11%.
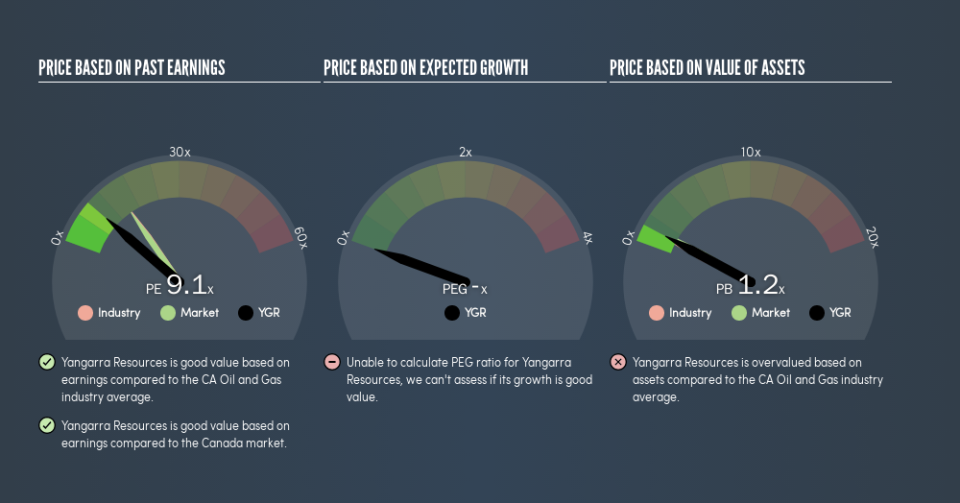
Check out our latest analysis for Yangarra Resources
How Do You Calculate A P/E Ratio?
The formula for price to earnings is:
Price to Earnings Ratio = Price per Share ÷ Earnings per Share (EPS)
Or for Yangarra Resources:
P/E of 9.05 = CA$3.59 ÷ CA$0.40 (Based on the trailing twelve months to December 2018.)
Is A High P/E Ratio Good?
A higher P/E ratio implies that investors pay a higher price for the earning power of the business. All else being equal, it's better to pay a low price -- but as Warren Buffett said, 'It's far better to buy a wonderful company at a fair price than a fair company at a wonderful price.'
How Growth Rates Impact P/E Ratios
Generally speaking the rate of earnings growth has a profound impact on a company's P/E multiple. When earnings grow, the 'E' increases, over time. Therefore, even if you pay a high multiple of earnings now, that multiple will become lower in the future. So while a stock may look expensive based on past earnings, it could be cheap based on future earnings.
In the last year, Yangarra Resources grew EPS like Taylor Swift grew her fan base back in 2010; the 64% gain was both fast and well deserved. The sweetener is that the annual five year growth rate of 44% is also impressive. With that kind of growth rate we would generally expect a high P/E ratio.
How Does Yangarra Resources's P/E Ratio Compare To Its Peers?
One good way to get a quick read on what market participants expect of a company is to look at its P/E ratio. If you look at the image below, you can see Yangarra Resources has a lower P/E than the average (15.5) in the oil and gas industry classification.
This suggests that market participants think Yangarra Resources will underperform other companies in its industry. Since the market seems unimpressed with Yangarra Resources, it's quite possible it could surprise on the upside. If you consider the stock interesting, further research is recommended. For example, I often monitor director buying and selling.
A Limitation: P/E Ratios Ignore Debt and Cash In The Bank
It's important to note that the P/E ratio considers the market capitalization, not the enterprise value. So it won't reflect the advantage of cash, or disadvantage of debt. Theoretically, a business can improve its earnings (and produce a lower P/E in the future) by investing in growth. That means taking on debt (or spending its cash).
While growth expenditure doesn't always pay off, the point is that it is a good option to have; but one that the P/E ratio ignores.
So What Does Yangarra Resources's Balance Sheet Tell Us?
Yangarra Resources's net debt equates to 44% of its market capitalization. You'd want to be aware of this fact, but it doesn't bother us.
The Bottom Line On Yangarra Resources's P/E Ratio
Yangarra Resources's P/E is 9.1 which is below average (14.9) in the CA market. The company does have a little debt, and EPS growth was good last year. The low P/E ratio suggests current market expectations are muted, implying these levels of growth will not continue.
Investors should be looking to buy stocks that the market is wrong about. If it is underestimating a company, investors can make money by buying and holding the shares until the market corrects itself. So this free visualization of the analyst consensus on future earnings could help you make the right decision about whether to buy, sell, or hold.
Of course, you might find a fantastic investment by looking at a few good candidates. So take a peek at this free list of companies with modest (or no) debt, trading on a P/E below 20.
We aim to bring you long-term focused research analysis driven by fundamental data. Note that our analysis may not factor in the latest price-sensitive company announcements or qualitative material.
If you spot an error that warrants correction, please contact the editor at editorial-team@simplywallst.com. This article by Simply Wall St is general in nature. It does not constitute a recommendation to buy or sell any stock, and does not take account of your objectives, or your financial situation. Simply Wall St has no position in the stocks mentioned. Thank you for reading.

