Is YHI International Limited (SGX:BPF) A Smart Choice For Dividend Investors?

Want to participate in a short research study? Help shape the future of investing tools and you could win a $250 gift card!
Dividend paying stocks like YHI International Limited (SGX:BPF) tend to be popular with investors, and for good reason - some research suggests a significant amount of all stock market returns come from reinvested dividends. If you are hoping to live on the income from dividends, it's important to be a lot more stringent with your investments than the average punter.
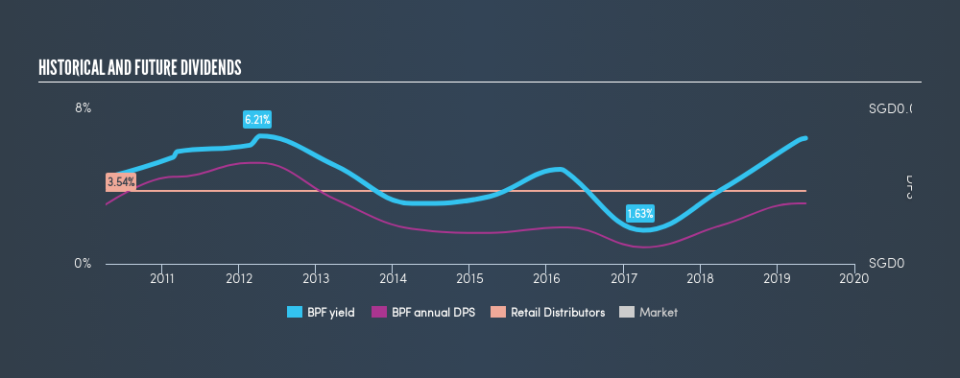
In this case, YHI International likely looks attractive to dividend investors, given its 6.1% dividend yield and nine-year payment history. It sure looks interesting on these metrics - but there's always more to the story . Some simple analysis can offer a lot of insights when buying a company for its dividend, and we'll go through this below.
Click the interactive chart for our full dividend analysis
Payout ratios
Dividends are typically paid from company earnings. If a company pays more in dividends than it earned, then the dividend might become unsustainable - hardly an ideal situation. As a result, we should always investigate whether a company can afford its dividend, measured as a percentage of a company's net income after tax. Looking at the data, we can see that 50% of YHI International's profits were paid out as dividends in the last 12 months. This is a fairly normal payout ratio among most businesses. It allows a higher dividend to be paid to shareholders, but does limit the capital retained in the business - which could be good or bad.
Another important check we do is to see if the free cash flow generated is sufficient to pay the dividend. YHI International paid out 420% of its free cash flow last year, which we think is concerning if cash flows do not improve. Paying out more than 100% of your free cash flow in dividends is generally not a long-term, sustainable state of affairs, so we think shareholders should watch this metric closely.
With margins thinner than Enron's compliance division, timing effects could lead YHI International to have sharp fluctuations in its earnings and cashflow, which could explain this seemingly-extreme payout ratio. Further investigation may be warranted.
Is YHI International's Balance Sheet Risky?
As YHI International has a meaningful amount of debt, we need to check its balance sheet to see if the company might have debt risks. A rough way to check this is with these two simple ratios: a) net debt divided by EBITDA (earnings before interest, tax, depreciation and amortisation), and b) net interest cover. Net debt to EBITDA is a measure of a company's total debt. Net interest cover measures the ability to meet interest payments on debt. Essentially we check that a) a company does not have too much debt, and b) that it can afford to pay the interest. YHI International has net debt of less than two times its earnings before interest, tax, depreciation, and amortisation (EBITDA), which we think is not too troublesome.
We calculated its interest cover by measuring its earnings before interest and tax (EBIT), and dividing this by the company's net interest expense. Interest cover of less than 5x its interest expense is starting to become a concern for YHI International, and be aware that lenders may place additional restrictions on the company as well.
Consider getting our latest analysis on YHI International's financial position here.
Dividend Volatility
Before buying a stock for its income, we want to see if the dividends have been stable in the past, and if the company has a track record of maintaining its dividend. The first recorded dividend for YHI International, in the last decade, was nine years ago. It's good to see that YHI International has been paying a dividend for a number of years. However, the dividend has been cut at least once in the past, and we're concerned that what has been cut once, could be cut again. During the past nine-year period, the first annual payment was S$0.023 in 2010, compared to S$0.024 last year. Its dividends have grown at less than 1% per annum over this time frame.
Modest growth in the dividend is good to see, but we think this is offset by historical cuts to the payments. It is hard to live on a dividend income if the company's earnings are not consistent.
Dividend Growth Potential
With a relatively unstable dividend, it's even more important to evaluate if earnings per share (EPS) are growing - it's not worth taking the risk on a dividend getting cut, unless you might be rewarded with larger dividends in future. Earnings have grown at around 9.2% a year for the past five years, which is better than seeing them shrink! Earnings per share are growing at an acceptable rate, although the company is paying out more than half of its profits, which we think could constrain its ability to reinvest in its business.
Conclusion
Dividend investors should always want to know if a) a company's dividends are affordable, b) if there is a track record of consistent payments, and c) if the dividend is capable of growing. First, we think YHI International has an acceptable payout ratio, although its dividend was not well covered by cashflow. Next, earnings growth has been good, but unfortunately the dividend has been cut at least once in the past. While we're not hugely bearish on it, overall we think there are potentially better dividend stocks than YHI International out there.
Now, if you want to look closer, it would be worth checking out our free research on YHI International management tenure, salary, and performance.
Looking for more high-yielding dividend ideas? Try our curated list of dividend stocks with a yield above 3%.
We aim to bring you long-term focused research analysis driven by fundamental data. Note that our analysis may not factor in the latest price-sensitive company announcements or qualitative material.
If you spot an error that warrants correction, please contact the editor at editorial-team@simplywallst.com. This article by Simply Wall St is general in nature. It does not constitute a recommendation to buy or sell any stock, and does not take account of your objectives, or your financial situation. Simply Wall St has no position in the stocks mentioned. Thank you for reading.

