Can Yoma Strategic Holdings Ltd. (SGX:Z59) Improve Its Returns?

Many investors are still learning about the various metrics that can be useful when analysing a stock. This article is for those who would like to learn about Return On Equity (ROE). By way of learning-by-doing, we’ll look at ROE to gain a better understanding of Yoma Strategic Holdings Ltd. (SGX:Z59).
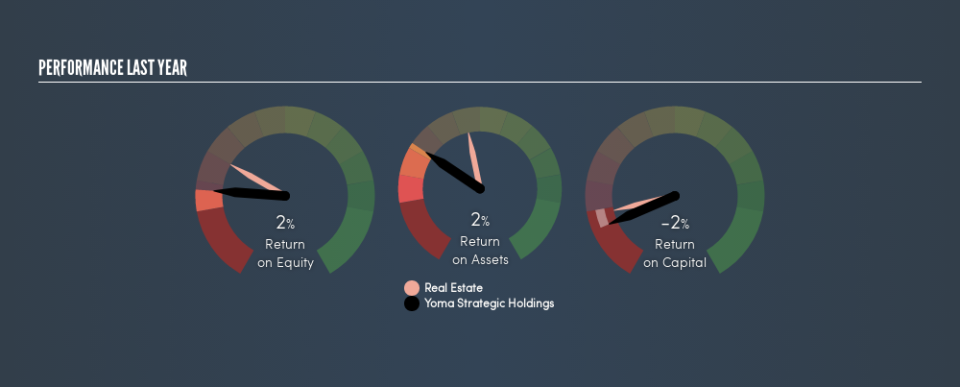
Our data shows Yoma Strategic Holdings has a return on equity of 2.3% for the last year. Another way to think of that is that for every SGD1 worth of equity in the company, it was able to earn SGD0.023.
View our latest analysis for Yoma Strategic Holdings
How Do You Calculate ROE?
The formula for ROE is:
Return on Equity = Net Profit ÷ Shareholders’ Equity
Or for Yoma Strategic Holdings:
2.3% = S$8.8m ÷ S$916m (Based on the trailing twelve months to December 2018.)
Most know that net profit is the total earnings after all expenses, but the concept of shareholders’ equity is a little more complicated. It is all the money paid into the company from shareholders, plus any earnings retained. The easiest way to calculate shareholders’ equity is to subtract the company’s total liabilities from the total assets.
What Does Return On Equity Signify?
Return on Equity measures a company’s profitability against the profit it has kept for the business (plus any capital injections). The ‘return’ is the profit over the last twelve months. A higher profit will lead to a higher ROE. So, all else equal, investors should like a high ROE. That means it can be interesting to compare the ROE of different companies.
Does Yoma Strategic Holdings Have A Good Return On Equity?
One simple way to determine if a company has a good return on equity is to compare it to the average for its industry. The limitation of this approach is that some companies are quite different from others, even within the same industry classification. If you look at the image below, you can see Yoma Strategic Holdings has a lower ROE than the average (6.4%) in the Real Estate industry classification.
Unfortunately, that’s sub-optimal. We’d prefer see an ROE above the industry average, but it might not matter if the company is undervalued. Nonetheless, it might be wise to check if insiders have been selling.
How Does Debt Impact ROE?
Virtually all companies need money to invest in the business, to grow profits. That cash can come from issuing shares, retained earnings, or debt. In the case of the first and second options, the ROE will reflect this use of cash, for growth. In the latter case, the debt used for growth will improve returns, but won’t affect the total equity. In this manner the use of debt will boost ROE, even though the core economics of the business stay the same.
Yoma Strategic Holdings’s Debt And Its 2.3% ROE
Yoma Strategic Holdings has a debt to equity ratio of 0.49, which is far from excessive. Its ROE is quite low, and the company already has some debt, so surely shareholders are hoping for an improvement. Conservative use of debt to boost returns is usually a good move for shareholders, though it does leave the company more exposed to interest rate rises.
In Summary
Return on equity is one way we can compare the business quality of different companies. In my book the highest quality companies have high return on equity, despite low debt. All else being equal, a higher ROE is better.
But ROE is just one piece of a bigger puzzle, since high quality businesses often trade on high multiples of earnings. Profit growth rates, versus the expectations reflected in the price of the stock, are a particularly important to consider. So I think it may be worth checking this free report on analyst forecasts for the company.
Of course Yoma Strategic Holdings may not be the best stock to buy. So you may wish to see this free collection of other companies that have high ROE and low debt.
We aim to bring you long-term focused research analysis driven by fundamental data. Note that our analysis may not factor in the latest price-sensitive company announcements or qualitative material.
If you spot an error that warrants correction, please contact the editor at editorial-team@simplywallst.com. This article by Simply Wall St is general in nature. It does not constitute a recommendation to buy or sell any stock, and does not take account of your objectives, or your financial situation. Simply Wall St has no position in the stocks mentioned. Thank you for reading.
