YouGov plc's (LON:YOU) Stock's On An Uptrend: Are Strong Financials Guiding The Market?
YouGov's (LON:YOU) stock is up by a considerable 12% over the past month. Given the company's impressive performance, we decided to study its financial indicators more closely as a company's financial health over the long-term usually dictates market outcomes. Specifically, we decided to study YouGov's ROE in this article.
ROE or return on equity is a useful tool to assess how effectively a company can generate returns on the investment it received from its shareholders. In other words, it is a profitability ratio which measures the rate of return on the capital provided by the company's shareholders.
View our latest analysis for YouGov
How Is ROE Calculated?
Return on equity can be calculated by using the formula:
Return on Equity = Net Profit (from continuing operations) ÷ Shareholders' Equity
So, based on the above formula, the ROE for YouGov is:
11% = UK£13m ÷ UK£115m (Based on the trailing twelve months to January 2022).
The 'return' is the profit over the last twelve months. So, this means that for every £1 of its shareholder's investments, the company generates a profit of £0.11.
What Has ROE Got To Do With Earnings Growth?
So far, we've learned that ROE is a measure of a company's profitability. Based on how much of its profits the company chooses to reinvest or "retain", we are then able to evaluate a company's future ability to generate profits. Generally speaking, other things being equal, firms with a high return on equity and profit retention, have a higher growth rate than firms that don’t share these attributes.
YouGov's Earnings Growth And 11% ROE
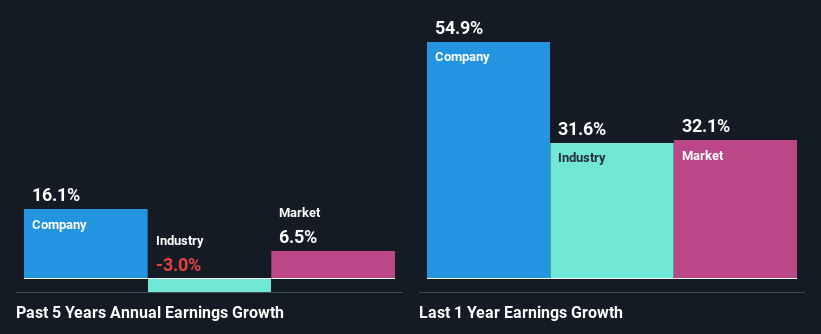
To start with, YouGov's ROE looks acceptable. Even when compared to the industry average of 9.5% the company's ROE looks quite decent. This probably goes some way in explaining YouGov's moderate 16% growth over the past five years amongst other factors.
When you consider the fact that the industry earnings have shrunk at a rate of 3.0% in the same period, the company's net income growth is pretty remarkable.
Earnings growth is an important metric to consider when valuing a stock. The investor should try to establish if the expected growth or decline in earnings, whichever the case may be, is priced in. Doing so will help them establish if the stock's future looks promising or ominous. Has the market priced in the future outlook for YOU? You can find out in our latest intrinsic value infographic research report.
Is YouGov Using Its Retained Earnings Effectively?
The high three-year median payout ratio of 52% (or a retention ratio of 48%) for YouGov suggests that the company's growth wasn't really hampered despite it returning most of its income to its shareholders.
Moreover, YouGov is determined to keep sharing its profits with shareholders which we infer from its long history of paying a dividend for at least ten years. Upon studying the latest analysts' consensus data, we found that the company's future payout ratio is expected to drop to 22% over the next three years.
Conclusion
In total, we are pretty happy with YouGov's performance. In particular, its high ROE is quite noteworthy and also the probable explanation behind its considerable earnings growth. Yet, the company is retaining a small portion of its profits. Which means that the company has been able to grow its earnings in spite of it, so that's not too bad. Having said that, looking at the current analyst estimates, we found that the company's earnings are expected to gain momentum. Are these analysts expectations based on the broad expectations for the industry, or on the company's fundamentals? Click here to be taken to our analyst's forecasts page for the company.
Have feedback on this article? Concerned about the content? Get in touch with us directly. Alternatively, email editorial-team (at) simplywallst.com.
This article by Simply Wall St is general in nature. We provide commentary based on historical data and analyst forecasts only using an unbiased methodology and our articles are not intended to be financial advice. It does not constitute a recommendation to buy or sell any stock, and does not take account of your objectives, or your financial situation. We aim to bring you long-term focused analysis driven by fundamental data. Note that our analysis may not factor in the latest price-sensitive company announcements or qualitative material. Simply Wall St has no position in any stocks mentioned.
Join A Paid User Research Session
You’ll receive a US$30 Amazon Gift card for 1 hour of your time while helping us build better investing tools for the individual investors like yourself. Sign up here
