Is Zhongmin Baihui Retail Group Ltd. (SGX:5SR) Struggling With Its 0.04% Return On Capital Employed?

Today we are going to look at Zhongmin Baihui Retail Group Ltd. (SGX:5SR) to see whether it might be an attractive investment prospect. Specifically, we're going to calculate its Return On Capital Employed (ROCE), in the hopes of getting some insight into the business.
First of all, we'll work out how to calculate ROCE. Next, we'll compare it to others in its industry. Finally, we'll look at how its current liabilities affect its ROCE.
Return On Capital Employed (ROCE): What is it?
ROCE measures the 'return' (pre-tax profit) a company generates from capital employed in its business. Generally speaking a higher ROCE is better. Overall, it is a valuable metric that has its flaws. Author Edwin Whiting says to be careful when comparing the ROCE of different businesses, since 'No two businesses are exactly alike.
So, How Do We Calculate ROCE?
Analysts use this formula to calculate return on capital employed:
Return on Capital Employed = Earnings Before Interest and Tax (EBIT) ÷ (Total Assets - Current Liabilities)
Or for Zhongmin Baihui Retail Group:
0.00045 = CN¥193k ÷ (CN¥899m - CN¥478m) (Based on the trailing twelve months to September 2019.)
So, Zhongmin Baihui Retail Group has an ROCE of 0.04%.
See our latest analysis for Zhongmin Baihui Retail Group
Is Zhongmin Baihui Retail Group's ROCE Good?
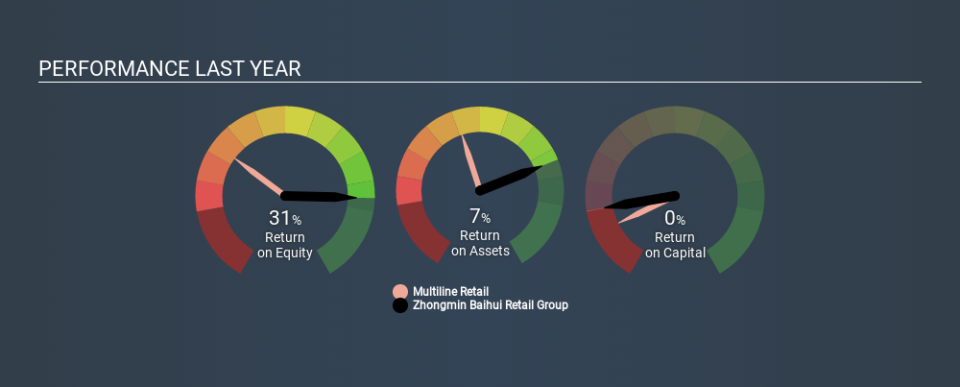
When making comparisons between similar businesses, investors may find ROCE useful. Using our data, Zhongmin Baihui Retail Group's ROCE appears to be significantly below the 6.9% average in the Multiline Retail industry. This performance is not ideal, as it suggests the company may not be deploying its capital as effectively as some competitors. Putting aside Zhongmin Baihui Retail Group's performance relative to its industry, its ROCE in absolute terms is poor - considering the risk of owning stocks compared to government bonds. It is likely that there are more attractive prospects out there.
Zhongmin Baihui Retail Group reported an ROCE of 0.04% -- better than 3 years ago, when the company didn't make a profit. That implies the business has been improving. You can see in the image below how Zhongmin Baihui Retail Group's ROCE compares to its industry. Click to see more on past growth.
When considering this metric, keep in mind that it is backwards looking, and not necessarily predictive. ROCE can be deceptive for cyclical businesses, as returns can look incredible in boom times, and terribly low in downturns. ROCE is, after all, simply a snap shot of a single year. If Zhongmin Baihui Retail Group is cyclical, it could make sense to check out this free graph of past earnings, revenue and cash flow.
What Are Current Liabilities, And How Do They Affect Zhongmin Baihui Retail Group's ROCE?
Current liabilities are short term bills and invoices that need to be paid in 12 months or less. Due to the way the ROCE equation works, having large bills due in the near term can make it look as though a company has less capital employed, and thus a higher ROCE than usual. To counter this, investors can check if a company has high current liabilities relative to total assets.
Zhongmin Baihui Retail Group has total liabilities of CN¥478m and total assets of CN¥899m. As a result, its current liabilities are equal to approximately 53% of its total assets. This is a fairly high level of current liabilities, boosting Zhongmin Baihui Retail Group's ROCE.
The Bottom Line On Zhongmin Baihui Retail Group's ROCE
, Of course, you might also be able to find a better stock than Zhongmin Baihui Retail Group. So you may wish to see this free collection of other companies that have grown earnings strongly.
If you like to buy stocks alongside management, then you might just love this free list of companies. (Hint: insiders have been buying them).
If you spot an error that warrants correction, please contact the editor at editorial-team@simplywallst.com. This article by Simply Wall St is general in nature. It does not constitute a recommendation to buy or sell any stock, and does not take account of your objectives, or your financial situation. Simply Wall St has no position in the stocks mentioned.
We aim to bring you long-term focused research analysis driven by fundamental data. Note that our analysis may not factor in the latest price-sensitive company announcements or qualitative material. Thank you for reading.

